
|
Avaliação DCF Instacart (CART) |
Totalmente Editável: Adapte-Se Às Suas Necessidades No Excel Ou Planilhas
Design Profissional: Modelos Confiáveis E Padrão Da Indústria
Pré-Construídos Para Uso Rápido E Eficiente
Compatível com MAC/PC, totalmente desbloqueado
Não É Necessária Experiência; Fácil De Seguir
Instacart (Maplebear Inc.) (CART) Bundle
Procurando determinar o valor intrínseco de Instacart? Nossa calculadora DCF (CART) integra dados do mundo real com opções extensas de personalização, permitindo refinar suas previsões e fazer escolhas de investimento mais informadas.
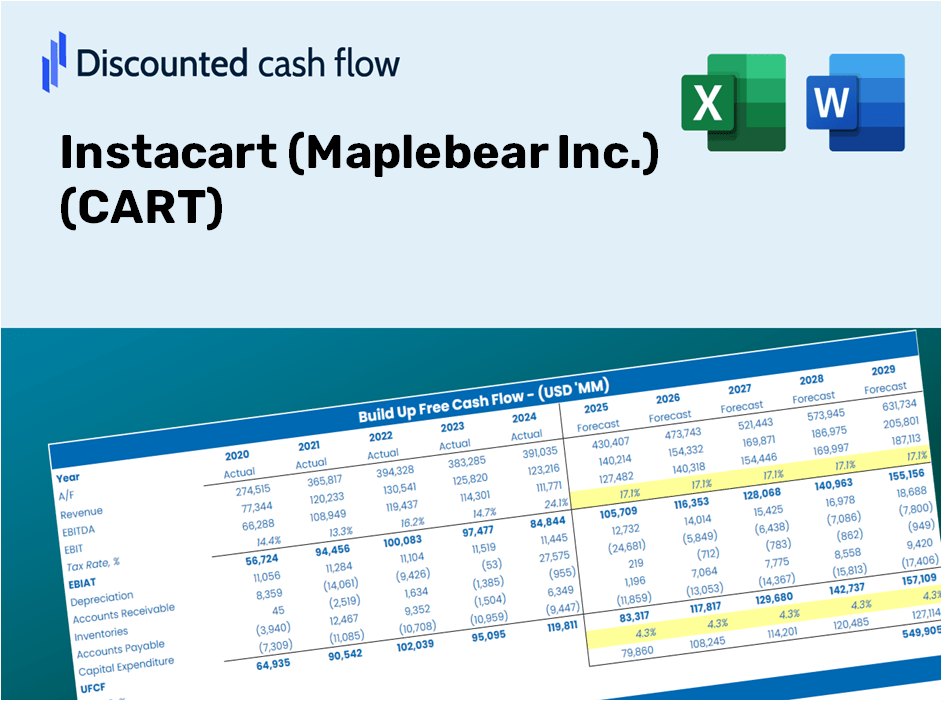
Discounted Cash Flow (DCF) - (USD MM)
| Year | AY1 2020 |
AY2 2021 |
AY3 2022 |
AY4 2023 |
AY5 2024 |
FY1 2025 |
FY2 2026 |
FY3 2027 |
FY4 2028 |
FY5 2029 |
|---|---|---|---|---|---|---|---|---|---|---|
| Revenue | 1,477.0 | 1,834.0 | 2,551.0 | 3,042.0 | 3,378.0 | 4,168.1 | 5,143.0 | 6,345.9 | 7,830.2 | 9,661.7 |
| Revenue Growth, % | 0 | 24.17 | 39.09 | 19.25 | 11.05 | 23.39 | 23.39 | 23.39 | 23.39 | 23.39 |
| EBITDA | -55.0 | -59.0 | 109.0 | -2,085.0 | 556.0 | -456.4 | -563.1 | -694.9 | -857.4 | -1,057.9 |
| EBITDA, % | -3.72 | -3.22 | 4.27 | -68.54 | 16.46 | -10.95 | -10.95 | -10.95 | -10.95 | -10.95 |
| Depreciation | 20.0 | 27.0 | 47.0 | 57.0 | 67.0 | 71.1 | 87.7 | 108.2 | 133.5 | 164.7 |
| Depreciation, % | 1.35 | 1.47 | 1.84 | 1.87 | 1.98 | 1.71 | 1.71 | 1.71 | 1.71 | 1.71 |
| EBIT | -75.0 | -86.0 | 62.0 | -2,142.0 | 489.0 | -527.5 | -650.8 | -803.1 | -990.9 | -1,222.7 |
| EBIT, % | -5.08 | -4.69 | 2.43 | -70.41 | 14.48 | -12.65 | -12.65 | -12.65 | -12.65 | -12.65 |
| Total Cash | 1,425.0 | 1,495.0 | 1,789.0 | 2,186.0 | 1,521.0 | 3,042.8 | 3,754.5 | 4,632.7 | 5,716.2 | 7,053.2 |
| Total Cash, percent | .0 | .0 | .0 | .0 | .0 | .0 | .0 | .0 | .0 | .0 |
| Account Receivables | 520.0 | 832.0 | 842.0 | 853.0 | 1,014.0 | 1,430.8 | 1,765.5 | 2,178.4 | 2,687.9 | 3,316.6 |
| Account Receivables, % | 35.21 | 45.37 | 33.01 | 28.04 | 30.02 | 34.33 | 34.33 | 34.33 | 34.33 | 34.33 |
| Inventories | .0 | .0 | .0 | .0 | .0 | .0 | .0 | .0 | .0 | .0 |
| Inventories, % | 0 | 0 | 0 | 0 | 0 | 0 | 0 | 0 | 0 | 0 |
| Accounts Payable | 23.0 | 60.0 | 88.0 | 72.0 | 80.0 | 108.5 | 133.9 | 165.2 | 203.8 | 251.5 |
| Accounts Payable, % | 1.56 | 3.27 | 3.45 | 2.37 | 2.37 | 2.6 | 2.6 | 2.6 | 2.6 | 2.6 |
| Capital Expenditure | -7.0 | -22.0 | -26.0 | -56.0 | -64.0 | -53.6 | -66.1 | -81.6 | -100.7 | -124.2 |
| Capital Expenditure, % | -0.47393 | -1.2 | -1.02 | -1.84 | -1.89 | -1.29 | -1.29 | -1.29 | -1.29 | -1.29 |
| Tax Rate, % | 17.21 | 17.21 | 17.21 | 17.21 | 17.21 | 17.21 | 17.21 | 17.21 | 17.21 | 17.21 |
| EBITAT | -75.0 | -87.2 | 373.7 | -1,685.7 | 404.8 | -486.8 | -600.7 | -741.2 | -914.6 | -1,128.5 |
| Depreciation | ||||||||||
| Changes in Account Receivables | ||||||||||
| Changes in Inventories | ||||||||||
| Changes in Accounts Payable | ||||||||||
| Capital Expenditure | ||||||||||
| UFCF | -559.0 | -357.2 | 412.7 | -1,711.7 | 254.8 | -857.7 | -888.4 | -1,096.2 | -1,352.6 | -1,669.0 |
| WACC, % | 8.97 | 8.97 | 8.97 | 8.97 | 8.97 | 8.97 | 8.97 | 8.97 | 8.97 | 8.97 |
| PV UFCF | ||||||||||
| SUM PV UFCF | -4,427.7 | |||||||||
| Long Term Growth Rate, % | 4.00 | |||||||||
| Free cash flow (T + 1) | -1,736 | |||||||||
| Terminal Value | -34,912 | |||||||||
| Present Terminal Value | -22,720 | |||||||||
| Enterprise Value | -27,147 | |||||||||
| Net Debt | -1,404 | |||||||||
| Equity Value | -25,743 | |||||||||
| Diluted Shares Outstanding, MM | 289 | |||||||||
| Equity Value Per Share | -89.03 |
What You Will Receive
- Adjustable Forecast Inputs: Easily modify key assumptions (growth %, margins, WACC) to generate various scenarios.
- Comprehensive Data: Instacart’s financial data pre-loaded to accelerate your analysis.
- Automated DCF Calculations: The template automatically computes Net Present Value (NPV) and intrinsic value for you.
- Professional and Tailored: A refined Excel model designed to meet your valuation requirements.
- Designed for Analysts and Investors: Perfect for evaluating projections, confirming strategies, and enhancing efficiency.
Key Features
- Pre-Loaded Data: Instacart's historical financial statements and pre-filled forecasts.
- Fully Adjustable Inputs: Modify WACC, tax rates, revenue growth, and EBITDA margins.
- Instant Results: Observe Instacart's intrinsic value recalculating in real-time.
- Clear Visual Outputs: Dashboard charts illustrate valuation results and key metrics.
- Built for Accuracy: A professional tool designed for analysts, investors, and finance experts.
How It Works
- Download: Obtain the comprehensive Excel file featuring Instacart's financial data.
- Customize: Tailor your forecasts, including revenue growth, EBITDA %, and WACC.
- Update Automatically: View real-time updates on intrinsic value and NPV calculations.
- Test Scenarios: Generate various projections and compare results instantly.
- Make Decisions: Leverage the valuation outcomes to refine your investment approach.
Why Opt for This Calculator?
- Precision: Utilizes accurate Instacart financials for reliable data.
- Versatility: Crafted for users to easily test and adjust inputs as needed.
- Efficiency: Eliminate the complexity of constructing a DCF model from the ground up.
- High-Quality: Built with CFO-level accuracy and practicality at the forefront.
- Intuitive: Simple enough for anyone, regardless of financial modeling expertise.
Who Can Benefit from This Product?
- Investors: Evaluate Instacart’s valuation prior to making stock transactions.
- CFOs and Financial Analysts: Optimize valuation methodologies and assess forecasts.
- Startup Founders: Understand the valuation strategies of leading public companies like Instacart.
- Consultants: Provide comprehensive valuation reports for clients based on Instacart’s performance.
- Students and Educators: Leverage real-world data to practice and instruct on valuation principles.
Contents of the Template
- Operating and Balance Sheet Data: Pre-filled historical data and forecasts for Instacart (Maplebear Inc.) (CART), including revenue, EBITDA, EBIT, and capital expenditures.
- WACC Calculation: A dedicated sheet for calculating the Weighted Average Cost of Capital (WACC), featuring parameters such as Beta, risk-free rate, and share price.
- DCF Valuation (Unlevered and Levered): Customizable Discounted Cash Flow models that provide intrinsic value along with detailed calculations.
- Financial Statements: Pre-loaded financial statements (both annual and quarterly) to facilitate comprehensive analysis.
- Key Ratios: Includes key profitability, leverage, and efficiency ratios for Instacart (Maplebear Inc.) (CART).
- Dashboard and Charts: A visual overview of valuation outputs and assumptions to simplify result analysis.
Disclaimer
All information, articles, and product details provided on this website are for general informational and educational purposes only. We do not claim any ownership over, nor do we intend to infringe upon, any trademarks, copyrights, logos, brand names, or other intellectual property mentioned or depicted on this site. Such intellectual property remains the property of its respective owners, and any references here are made solely for identification or informational purposes, without implying any affiliation, endorsement, or partnership.
We make no representations or warranties, express or implied, regarding the accuracy, completeness, or suitability of any content or products presented. Nothing on this website should be construed as legal, tax, investment, financial, medical, or other professional advice. In addition, no part of this site—including articles or product references—constitutes a solicitation, recommendation, endorsement, advertisement, or offer to buy or sell any securities, franchises, or other financial instruments, particularly in jurisdictions where such activity would be unlawful.
All content is of a general nature and may not address the specific circumstances of any individual or entity. It is not a substitute for professional advice or services. Any actions you take based on the information provided here are strictly at your own risk. You accept full responsibility for any decisions or outcomes arising from your use of this website and agree to release us from any liability in connection with your use of, or reliance upon, the content or products found herein.