
|
Cass Information Systems, Inc. (CASS): 5 forças Análise [Jan-2025 Atualizada] |
Totalmente Editável: Adapte-Se Às Suas Necessidades No Excel Ou Planilhas
Design Profissional: Modelos Confiáveis E Padrão Da Indústria
Pré-Construídos Para Uso Rápido E Eficiente
Compatível com MAC/PC, totalmente desbloqueado
Não É Necessária Experiência; Fácil De Seguir
Cass Information Systems, Inc. (CASS) Bundle
No cenário dinâmico da tecnologia financeira, a CASS Information Systems, Inc. (CASS) navega em um ecossistema complexo de forças competitivas que moldam seu posicionamento estratégico. Como um participante importante nas soluções de processamento de pagamentos e bancos, a empresa enfrenta um desafio multifacetado de equilibrar a inovação tecnológica, a concorrência de mercado e a evolução das demandas dos clientes. Esse mergulho profundo nas cinco forças de Porter revela a intrincada dinâmica que impulsiona a estratégia competitiva de Cass, explorando a interação diferenciada de poder de fornecedor, relacionamentos com clientes, rivalidade de mercado, substitutos em potencial e barreiras à entrada que definem sua trajetória de negócios em 2024.
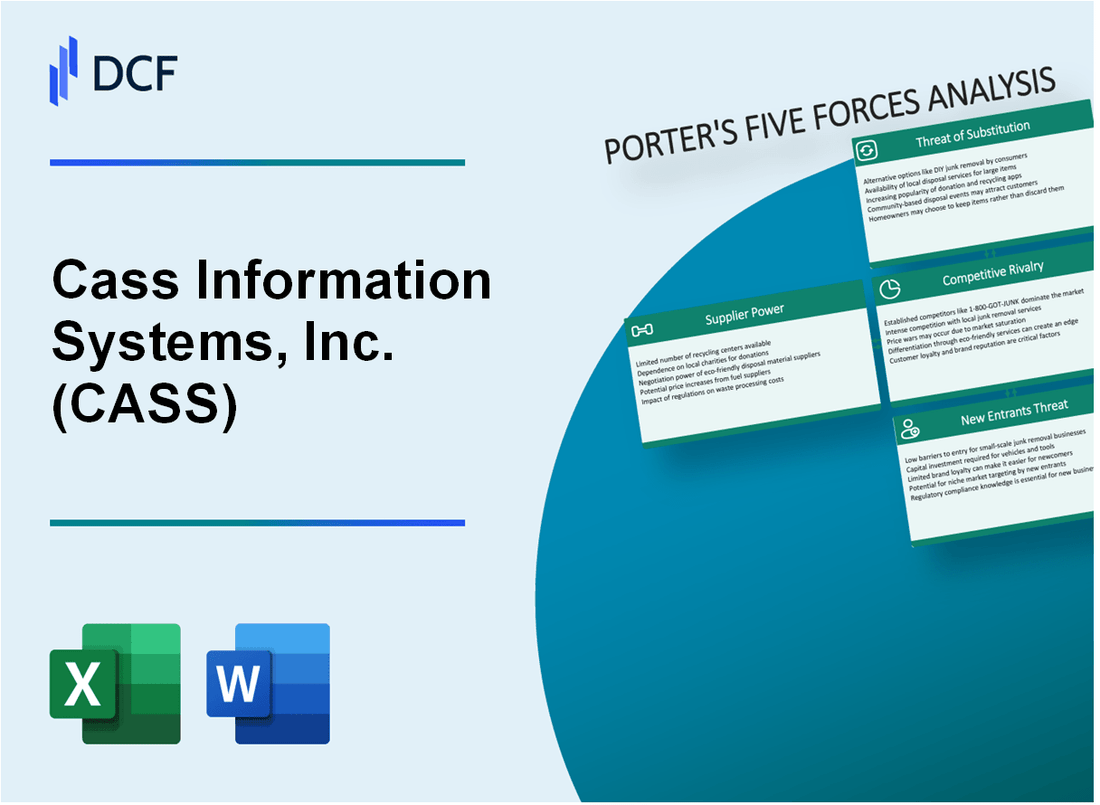
CASS Information Systems, Inc. (CASS) - As cinco forças de Porter: poder de barganha dos fornecedores
Número limitado de provedores de software de tecnologia e tecnologia especializados
A partir de 2024, o mercado de software bancário principal é dominado por alguns provedores importantes:
| Fornecedor | Quota de mercado | Receita anual |
|---|---|---|
| Fiserv | 35.2% | US $ 14,3 bilhões |
| Jack Henry & Associados | 26.7% | US $ 1,68 bilhão |
| FIS Global | 28.5% | US $ 12,6 bilhões |
Altos custos de comutação para a infraestrutura do sistema bancário principal
A troca de custos para a infraestrutura de tecnologia bancária é significativa:
- Custos de implementação: US $ 2,5 milhões a US $ 7,8 milhões
- Tempo médio de migração: 18-24 meses
- Potencial Interrupção Operacional: 40-60% do custo total do projeto
Dependência de fornecedores de tecnologia -chave para soluções de processamento de pagamento
Concentração do fornecedor de processamento de pagamento:
| Fornecedor | Concentração de mercado | Volume de transação |
|---|---|---|
| Visa | 53.3% | 124,3 bilhões de transações |
| MasterCard | 31.7% | 92,6 bilhões de transações |
Potencial para relações contratuais de longo prazo com os principais fornecedores de tecnologia
Características típicas do contrato:
- Duração média do contrato: 5-7 anos
- Gastos anuais para fornecedores de tecnologia: US $ 3,2 milhões a US $ 5,6 milhões
- Taxas de renovação: 85-92%
CASS Information Systems, Inc. (CASS) - As cinco forças de Porter: poder de barganha dos clientes
Base de clientes concentrados
A partir do quarto trimestre 2023, os sistemas de informação do CASS atendem a 69 instituições financeiras, com 80% da receita derivada do setor de serviços bancários e financeiros. Os 10 principais clientes representam 42,3% da receita total da empresa.
| Segmento de clientes | Porcentagem de receita |
|---|---|
| Instituições bancárias | 62.5% |
| Serviços financeiros | 17.5% |
| Outras indústrias | 20% |
Custos de troca de clientes
Custos de troca de soluções de pagamento e tecnologia integrados estimados em US $ 1,2 milhão a US $ 2,5 milhões por transição do cliente, criando barreira moderada à migração de clientes.
- Tempo médio de integração da tecnologia: 4-6 meses
- Faixa de custo de implementação: US $ 750.000 - US $ 1,5 milhão
- Complexidade da migração de dados: alta
Análise de sensibilidade ao preço
A elasticidade do preço de mercado da tecnologia financeira indica 15-20% do limite de sensibilidade ao preço do cliente. O valor médio do contrato varia de US $ 350.000 a US $ 2,3 milhões anualmente.
| Mudança de preço | Impacto de retenção de clientes |
|---|---|
| 0-5% de aumento | Taxa de retenção de 95% |
| Aumento de 6 a 10% | Taxa de retenção de 85% |
| Aumento de 11 a 15% | Taxa de retenção de 72% |
Estratégias de retenção de clientes
As ofertas de serviço personalizadas incluem:
- Soluções de processamento de pagamento personalizadas
- Integração avançada de análise
- Equipes de suporte dedicados 24 horas por dia, 7 dias por semana
- Recursos de relatórios personalizados
CASS Information Systems, Inc. (CASS) - As cinco forças de Porter: rivalidade competitiva
Cenário competitivo de mercado
A CASS Information Systems, Inc. enfrenta uma rivalidade competitiva significativa nos setores de tecnologia financeira e processamento de pagamentos. A partir do quarto trimestre 2023, os principais concorrentes incluem:
| Concorrente | Capitalização de mercado | Receita anual |
|---|---|---|
| FIS (Serviços de Informação Financeira) | US $ 35,6 bilhões | US $ 14,3 bilhões |
| Fiserv, Inc. | US $ 28,9 bilhões | US $ 16,2 bilhões |
| Jack Henry & Associados | US $ 12,4 bilhões | US $ 1,8 bilhão |
Investimento em tecnologia e inovação
A intensidade competitiva é impulsionada por investimentos tecnológicos contínuos. Em 2023, as principais métricas de gastos com tecnologia incluem:
- Gastos de P&D: 8-12% da receita anual
- Investimentos em migração em nuvem: US $ 50-75 milhões anualmente
- Orçamento de aprimoramento de segurança cibernética: US $ 25-40 milhões por ano
Posicionamento do mercado regional
Os sistemas de informação do CASS demonstram fortes vantagens competitivas regionais nos mercados bancários dos Estados Unidos do Centro -Oeste, com a seguinte distribuição de participação de mercado:
| Estado | Quota de mercado | Número de clientes bancários |
|---|---|---|
| Missouri | 22.5% | 187 Instituições Financeiras |
| Illinois | 18.3% | 142 Instituições Financeiras |
| Kansas | 15.7% | 98 instituições financeiras |
Métricas de diferenciação competitiva
Os principais fatores de diferenciação competitiva para os sistemas de informação CASS incluem:
- Volume de processamento de pagamento: US $ 124,6 bilhões anualmente
- Velocidade de processamento da transação: 0,03 segundos por transação
- Taxa de retenção de clientes: 94,2%
CASS Information Systems, Inc. (CASS) - As cinco forças de Porter: ameaça de substitutos
Soluções emergentes de fintech desafiando tecnologias bancárias tradicionais
Os investimentos globais da Fintech atingiram US $ 164,1 bilhões em 2022. As alternativas de banco digital aumentaram a participação de mercado em 12,7% anualmente. As startups da Fintech capturaram 5,2% da receita total de serviços financeiros em 2023.
| Fintech Metric | 2023 valor |
|---|---|
| Tamanho do mercado global de fintech | US $ 110,5 bilhões |
| Taxa de adoção bancária digital | 65.3% |
| Crescimento anual do investimento | 18.2% |
Plataformas bancárias baseadas em nuvem oferecendo modelos de serviço alternativos
O mercado da plataforma bancária em nuvem projetou para atingir US $ 52,8 bilhões até 2026. Os serviços públicos em nuvem em serviços financeiros cresceram para US $ 206,2 bilhões em 2023.
- A SaaS Banking Solutions aumentou a penetração no mercado em 22,4%
- A migração em nuvem reduz os custos operacionais em 35-40%
- Investimentos de segurança em plataformas em nuvem atingiram US $ 18,3 bilhões
Aumentando plataformas de pagamento digital e aplicativos bancários móveis
O volume de transações de pagamento móvel atingiu US $ 9,46 trilhões globalmente em 2023. O uso da carteira digital expandiu -se para 4,4 bilhões de usuários em todo o mundo.
| Métrica de pagamento móvel | 2023 Estatísticas |
|---|---|
| Volume de transação global | US $ 9,46 trilhões |
| Usuários da carteira digital | 4,4 bilhões |
| Crescimento anual da transação | 16.5% |
Tecnologias potenciais de blockchain e criptomoeda como substitutos futuros
Tamanho do mercado de blockchain projetado para atingir US $ 94,0 bilhões até 2027. A capitalização de mercado da criptomoeda totalizou US $ 1,63 trilhão em 2023.
- O investimento em tecnologia blockchain atingiu US $ 16,3 bilhões
- As plataformas de finanças descentralizadas (DEFI) cresceram para US $ 75,6 bilhões
- O volume da transação de criptomoeda excedeu US $ 15,8 trilhões
CASS Information Systems, Inc. (CASS) - As cinco forças de Porter: ameaça de novos participantes
Altos requisitos de capital inicial para infraestrutura de tecnologia financeira
A infraestrutura de tecnologia financeira da CASS Information Systems requer investimento substancial. Em 2024, as despesas de capital inicial estimadas para entrada no mercado varia entre US $ 15 milhões e US $ 25 milhões.
| Componente de infraestrutura | Custo estimado |
|---|---|
| Sistemas bancários principais | US $ 7,5 milhões |
| Infraestrutura de segurança cibernética | US $ 4,2 milhões |
| Configuração do data center | US $ 5,3 milhões |
| Sistemas de rede e comunicação | US $ 3,6 milhões |
Barreiras complexas de conformidade regulatória
A conformidade regulatória representa uma barreira significativa à entrada do mercado. Em 2024, as empresas de tecnologia financeira devem navegar por vários requisitos de conformidade.
- Custo médio anual de conformidade: US $ 3,8 milhões
- Duração do processo de certificação regulatória: 18-24 meses
- Requisito da equipe de conformidade: mínimo 12-15 Profissionais especializados
Relacionamentos estabelecidos com instituições financeiras
Sistemas de informação CASS mantêm Contratos de longo prazo com 87 instituições financeiras A partir de 2024, criando barreiras significativas de entrada no mercado.
| Tipo de contrato | Número de contratos | Duração média do contrato |
|---|---|---|
| Parcerias bancárias | 52 | 7,3 anos |
| Acordos de cooperação de crédito | 35 | 6,9 anos |
Requisitos de especialização tecnológica
A entrada de mercado exige recursos tecnológicos especializados. Em 2024, novos participantes devem demonstrar:
- Mínimo 5 anos de experiência em desenvolvimento de tecnologia financeira
- Certificações avançadas de segurança cibernética
- Recorde comprovado de implantações de software financeiro de sucesso
O investimento em especialização tecnológico geralmente varia de US $ 4,5 milhões a US $ 6,2 milhões para novos participantes do mercado.
Cass Information Systems, Inc. (CASS) - Porter's Five Forces: Competitive rivalry
Rivalry is high with specialized expense management firms like Tangoe, which emphasizes its use of AI-powered tools and holds over 70 patents to drive visibility and control over telecom expenses, and brightfin, which offers Technology Expense Management (TEM) and IT Finance Management solutions natively through ServiceNow or as a SaaS platform. Furthermore, Cass Information Systems, Inc. (CASS) faces competition from larger financial and banking competitors. It is important to note that Cass Information Systems, Inc. (CASS) sold its Telecom Expense Management (TEM) business to Asignet USA Inc. in the third quarter of 2025, which shifts the competitive dynamic in that specific area.
Cass Information Systems, Inc. (CASS) is a market leader in US transportation bill processing, which provides a significant scale advantage in what remains a fragmented industry. For the third quarter of 2025, Cass Information Systems, Inc. (CASS) processed transportation dollar volumes of $9.3 billion and handled 8.9 million transportation invoices.
The company maintains a strong net margin of 16.48%, indicating a defensible cost structure against many rivals, especially when compared to First Busey's net margin of 11.00%. This profitability is supported by operational efficiency metrics, such as the 15.29% Return on Average Equity reported for the third quarter of 2025. The company's ability to maintain strong margins is partly due to internal technological advancements.
Competition is increasingly focused on integrating AI and machine learning for automation and predictive analytics. Cass Information Systems, Inc. (CASS) has already integrated this technology into its facility line of business, reporting that greater than 80% of invoices are processed in AI-enabled, automated systems as of the third quarter of 2025, which allows for continued efficiencies in data ingestion.
Here's a quick look at the scale of operations and recent financial performance metrics relevant to competitive positioning:
| Metric | Value (Latest Reported Period) | Context/Comparison |
|---|---|---|
| Net Margin | 16.48% | Indicates a strong cost structure relative to some peers. |
| Q3 2025 Net Income | $9.1 million | Reported for the third quarter of 2025. |
| Q3 2025 Transportation Dollar Volumes | $9.3 billion | Shows the scale of the core transportation business. |
| Q3 2025 Transportation Invoice Volumes | 8.9 million | Volume of invoices processed in the transportation segment. |
| Q3 2025 Return on Average Equity | 15.29% | A measure of profitability relative to shareholder investment. |
| AI Automation in Facility Invoices | Greater than 80% | Percentage of facility invoices processed using AI-enabled systems. |
The focus on technology is a direct response to competitive pressures requiring greater automation. You can see the impact of this focus in the operational statistics:
- Tangoe highlights over 70 patents in its TEM solution.
- Cass Information Systems, Inc. (CASS) reported a 19.3% increase in net interest income in Q3 2025.
- The company is consolidating functions across business lines, anticipating savings in 2026.
- Cass Information Systems, Inc. (CASS) has a current stock price around $39.43 as of late 2025.
If onboarding new, high-dollar clients takes longer than anticipated, the growth in facility expense dollar volumes, which rose 13.9% in Q3 2025, could slow down. Finance: draft Q4 2025 expense forecast by next Tuesday.
Cass Information Systems, Inc. (CASS) - Porter's Five Forces: Threat of substitutes
You're looking at the threat of substitutes for Cass Information Systems, Inc. (CASS), and honestly, the alternatives aren't always shiny new tech; often, they are just the old ways of doing things, or less specialized software. Primary substitutes boil down to simple manual processes or less sophisticated, general-purpose enterprise resource planning (ERP) modules that companies might try to adapt for invoice management. To put this in perspective, Cass Information Systems is disbursing over $90 billion annually on behalf of clients, handling massive volumes like $9.4 billion in transportation dollar volumes in Q2 2025 alone. That scale is tough to replicate with manual entry or off-the-shelf software that wasn't built for the nuances of freight and utility compliance.
The threat from these basic substitutes is mitigated by the sheer volume and complexity Cass manages. Consider the operational scale from the first half of 2025:
| Metric (As of Q2 2025) | Transportation | Facility Expense |
|---|---|---|
| Invoice Volumes (Millions) | 8.84 million | 4.1 million |
| Dollar Volumes (Billions USD) | $9.4 billion | $5.5 billion |
Still, the market for these services is large, with the global Freight Audit and Payment Service market size projected to reach 1,272.62 Million USD in 2025, meaning there's a big pool of spend that could be managed internally or via simpler tools.
Large corporations certainly have the capital for in-house development, but that path often stalls when deep, specialized domain expertise is required. Cass Information Systems, Inc. has core competencies in data acquisition, data management, business intelligence, and financial exchange, which are built over decades. For instance, by Q3 2025, technological improvements meant greater than 80% of facility invoices were processed in AI-enabled, automated systems. Replicating that specialized compliance and automation engine in-house is a multi-year, multi-million-dollar undertaking that most firms won't start.
We also see indirect competition from advanced Building Management Systems (BMS) that offer some overlap, particularly in utility expense optimization. While a BMS might give you real-time energy usage data, it typically doesn't handle the full audit, payment, and complex reporting across thousands of utility bills like Cass does. The focus of a BMS is operational control, not necessarily the granular financial reconciliation Cass provides. You see this difference in the Q2 2025 results where facility expense dollar volumes grew 16.1% year-over-year, suggesting clients value that specialized financial oversight.
The most difficult feature to substitute, however, is the integrated financial exchange powered by Cass Commercial Bank. This wholly owned subsidiary, with total assets of $2.3 billion, allows Cass Information Systems to manage customer funds and offer sophisticated payment solutions directly. This banking integration is a structural advantage. It's not just a software feature; it's a regulated financial utility underpinning the service. The ability to process and pay invoices while leveraging the bank's float and balance sheet is a moat against pure-play software competitors who must rely on third-party banking partners.
Here are a few key operational metrics that define the scale Cass must defend against substitutes:
- TTM Revenue (as of Sep-2025): $196M
- Q3 2025 Revenue: $54.01 million
- Total Employees (as of Feb 21, 2025): 1,027 full-time
- TTM EPS (as of Q3 2025): $2.33
Finance: draft 13-week cash view by Friday.
Cass Information Systems, Inc. (CASS) - Porter's Five Forces: Threat of new entrants
The threat of new entrants for Cass Information Systems, Inc. is defintely low. This is primarily due to the significant, structural barriers to entry inherent in the services Cass Information Systems provides, most notably the requirement of a commercial bank charter for certain operations or the complexity of navigating the existing regulatory maze.
High regulatory compliance and capital requirements for banking services actively deter most fintech startups. While 2025 saw an all-time high of 20 bank charter filings submitted through October 3rd by fintechs seeking greater control, this path remains a significant undertaking requiring a thoughtful approach and substantial investment of time, effort, and capital. The Office of the Comptroller of the Currency (OCC) mandates that any fintech national bank must demonstrate it can manage compliance risks and maintain capital and liquidity levels commensurate with the risk and complexity of its proposed activities.
New entrants must overcome the need for deep, proprietary expertise in complex logistics and utility billing data. The challenges are not just regulatory; they are operational and technical. For instance, in the related logistics sector, 47% of executives cited integration with legacy systems as the biggest obstacle to automation, and 31% admitted they lack the in-house logistics and technology expertise to drive digital projects. This suggests that replicating Cass Information Systems' established capability requires overcoming significant, embedded technical debt and specialized knowledge that is not easily acquired.
Furthermore, the Utilities Data Analytics Market entry itself requires substantial initial investment in facilities, distribution networks, and marketing, alongside navigating complex regulatory hurdles and industry standards. This capital intensity acts as a strong deterrent for smaller, newer players.
Cass Information Systems' established scale reflects a financial moat that is costly to challenge directly. The company's established presence and revenue base provide a cushion against smaller, agile competitors trying to gain traction. Consider the financial scale as of late 2025:
| Financial Metric | Amount | Date/Period |
| Trailing 12-Month Revenue | $196M | As of 30-Sep-2025 |
| Quarterly Revenue | $50.06 million | Quarter ended Sep 30, 2025 |
| Market Capitalization | $522M | As of 31-Oct-2025 |
The need for new entrants to match this scale, especially when facing the high capital requirements of the banking or complex data processing sectors, keeps the threat level low. The complexity is multifaceted, involving:
- Navigating the patchwork of state money-transmitter licenses if avoiding a full charter.
- Meeting the high capital buffers required for a full national bank charter.
- Overcoming strong customer loyalty enjoyed by established brands in related data markets.
- Addressing the costly and risky integration with existing client legacy systems.
You need to factor in the time it takes to build the necessary regulatory relationships and compliance infrastructure; it's not just about writing code.
Disclaimer
All information, articles, and product details provided on this website are for general informational and educational purposes only. We do not claim any ownership over, nor do we intend to infringe upon, any trademarks, copyrights, logos, brand names, or other intellectual property mentioned or depicted on this site. Such intellectual property remains the property of its respective owners, and any references here are made solely for identification or informational purposes, without implying any affiliation, endorsement, or partnership.
We make no representations or warranties, express or implied, regarding the accuracy, completeness, or suitability of any content or products presented. Nothing on this website should be construed as legal, tax, investment, financial, medical, or other professional advice. In addition, no part of this site—including articles or product references—constitutes a solicitation, recommendation, endorsement, advertisement, or offer to buy or sell any securities, franchises, or other financial instruments, particularly in jurisdictions where such activity would be unlawful.
All content is of a general nature and may not address the specific circumstances of any individual or entity. It is not a substitute for professional advice or services. Any actions you take based on the information provided here are strictly at your own risk. You accept full responsibility for any decisions or outcomes arising from your use of this website and agree to release us from any liability in connection with your use of, or reliance upon, the content or products found herein.