
|
Chubb Limited (CB) DCF Valuation |
Totalmente Editável: Adapte-Se Às Suas Necessidades No Excel Ou Planilhas
Design Profissional: Modelos Confiáveis E Padrão Da Indústria
Pré-Construídos Para Uso Rápido E Eficiente
Compatível com MAC/PC, totalmente desbloqueado
Não É Necessária Experiência; Fácil De Seguir
Chubb Limited (CB) Bundle
Explore Chubb Limited's (CB) financial outlook with our user-friendly DCF Calculator! Enter your assumptions for growth, margins, and costs to calculate Chubb Limited's (CB) intrinsic value and inform your investment decisions.
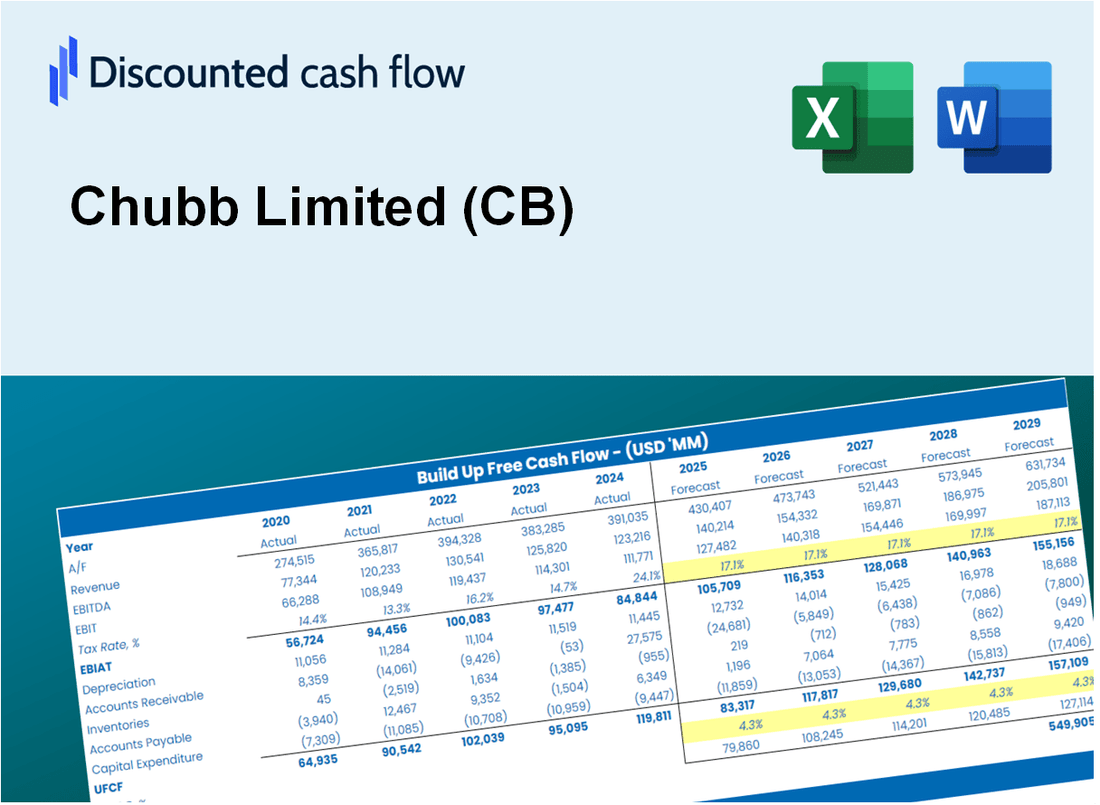
Discounted Cash Flow (DCF) - (USD MM)
| Year | AY1 2021 |
AY2 2022 |
AY3 2023 |
AY4 2024 |
AY5 2025 |
FY1 2026 |
FY2 2027 |
FY3 2028 |
FY4 2029 |
FY5 2030 |
|---|---|---|---|---|---|---|---|---|---|---|
| Revenue | 40,770.0 | 42,975.0 | 50,133.0 | 56,150.0 | 59,582.0 | 65,566.8 | 72,152.8 | 79,400.4 | 87,375.9 | 96,152.6 |
| Revenue Growth, % | 0 | 5.41 | 16.66 | 12 | 6.11 | 10.04 | 10.04 | 10.04 | 10.04 | 10.04 |
| EBITDA | 10,573.0 | 7,340.0 | 10,508.0 | 12,519.0 | 10,080.0 | 13,531.3 | 14,890.4 | 16,386.1 | 18,032.1 | 19,843.3 |
| EBITDA, % | 25.93 | 17.08 | 20.96 | 22.3 | 16.92 | 20.64 | 20.64 | 20.64 | 20.64 | 20.64 |
| Depreciation | 287.0 | 285.0 | 310.0 | 323.0 | 298.0 | 401.4 | 441.7 | 486.1 | 534.9 | 588.6 |
| Depreciation, % | 0.70395 | 0.66318 | 0.61836 | 0.57524 | 0.50015 | 0.61218 | 0.61218 | 0.61218 | 0.61218 | 0.61218 |
| EBIT | 10,286.0 | 7,055.0 | 10,198.0 | 12,196.0 | 9,782.0 | 13,129.9 | 14,448.7 | 15,900.1 | 17,497.2 | 19,254.7 |
| EBIT, % | 25.23 | 16.42 | 20.34 | 21.72 | 16.42 | 20.03 | 20.03 | 20.03 | 20.03 | 20.03 |
| Total Cash | 97,913.0 | 25,785.0 | 33,787.0 | 39,185.0 | 2,470.0 | 39,514.1 | 43,483.1 | 47,850.9 | 52,657.4 | 57,946.7 |
| Total Cash, percent | .0 | .0 | .0 | .0 | .0 | .0 | .0 | .0 | .0 | .0 |
| Account Receivables | 28,901.0 | 31,094.0 | 33,611.0 | 34,492.0 | 15,944.0 | 39,139.9 | 43,071.4 | 47,397.8 | 52,158.8 | 57,398.0 |
| Account Receivables, % | 70.89 | 72.35 | 67.04 | 61.43 | 26.76 | 59.69 | 59.69 | 59.69 | 59.69 | 59.69 |
| Inventories | .0 | .0 | .0 | .0 | .0 | .0 | .0 | .0 | .0 | .0 |
| Inventories, % | 0 | 0 | 0 | 0 | 0 | 0 | 0 | 0 | 0 | 0 |
| Accounts Payable | 7,243.0 | 7,780.0 | 8,302.0 | 8,121.0 | .0 | 8,771.8 | 9,652.9 | 10,622.5 | 11,689.5 | 12,863.7 |
| Accounts Payable, % | 17.77 | 18.1 | 16.56 | 14.46 | 0 | 13.38 | 13.38 | 13.38 | 13.38 | 13.38 |
| Capital Expenditure | .0 | .0 | .0 | .0 | .0 | .0 | .0 | .0 | .0 | .0 |
| Capital Expenditure, % | 0 | 0 | 0 | 0 | 0 | 0 | 0 | 0 | 0 | 0 |
| Tax Rate, % | 20.96 | 20.96 | 20.96 | 20.96 | 20.96 | 20.96 | 20.96 | 20.96 | 20.96 | 20.96 |
| EBITAT | 8,953.3 | 5,707.1 | 9,664.9 | 9,871.8 | 7,731.7 | 11,099.8 | 12,214.7 | 13,441.7 | 14,791.9 | 16,277.7 |
| Depreciation | ||||||||||
| Changes in Account Receivables | ||||||||||
| Changes in Inventories | ||||||||||
| Changes in Accounts Payable | ||||||||||
| Capital Expenditure | ||||||||||
| UFCF | -12,417.7 | 4,336.1 | 7,979.9 | 9,132.8 | 18,456.7 | -2,922.9 | 9,606.1 | 10,571.0 | 11,632.8 | 12,801.3 |
| WACC, % | 5.61 | 5.58 | 5.65 | 5.58 | 5.57 | 5.6 | 5.6 | 5.6 | 5.6 | 5.6 |
| PV UFCF | ||||||||||
| SUM PV UFCF | 33,930.6 | |||||||||
| Long Term Growth Rate, % | 2.00 | |||||||||
| Free cash flow (T + 1) | 13,057 | |||||||||
| Terminal Value | 363,070 | |||||||||
| Present Terminal Value | 276,533 | |||||||||
| Enterprise Value | 310,463 | |||||||||
| Net Debt | 19,717 | |||||||||
| Equity Value | 290,746 | |||||||||
| Diluted Shares Outstanding, MM | 397 | |||||||||
| Equity Value Per Share | 733.28 |
What You Will Get
- Real CB Financials: Access to historical and projected data for precise valuation.
- Customizable Inputs: Adjust WACC, tax rates, revenue growth, and capital expenditures as needed.
- Dynamic Calculations: Intrinsic value and NPV are computed automatically.
- Scenario Analysis: Evaluate various scenarios to assess Chubb's future performance.
- User-Friendly Design: Designed for professionals while remaining accessible to newcomers.
Key Features
- Comprehensive Data: Chubb Limited’s (CB) historical financial statements and detailed forecasts.
- Customizable Parameters: Adjust WACC, tax rates, revenue growth, and EBITDA margins as needed.
- Real-Time Insights: View Chubb Limited’s (CB) intrinsic value update instantly.
- Intuitive Visualizations: Dashboard graphs illustrate valuation outcomes and essential metrics.
- Designed for Precision: A reliable tool tailored for analysts, investors, and finance professionals.
How It Works
- Step 1: Download the prebuilt Excel template with Chubb Limited’s (CB) data included.
- Step 2: Explore the pre-filled sheets and familiarize yourself with the key metrics.
- Step 3: Update forecasts and assumptions in the editable yellow cells (WACC, growth, margins).
- Step 4: Instantly view recalculated results, including Chubb Limited’s (CB) intrinsic value.
- Step 5: Make informed investment decisions or generate reports using the outputs.
Why Choose This Calculator for Chubb Limited (CB)?
- User-Friendly Interface: Crafted for both novices and seasoned users.
- Customizable Inputs: Adjust variables to suit your financial analysis needs.
- Real-Time Feedback: Watch Chubb Limited’s valuation update instantly as you make changes.
- Preloaded Data: Comes with Chubb Limited’s current financial information for swift evaluations.
- Relied Upon by Experts: Favored by investors and analysts for making well-informed choices.
Who Should Use This Product?
- Finance Students: Discover risk management strategies and apply them using real-world data.
- Academics: Integrate industry-leading models into your coursework or research initiatives.
- Investors: Validate your investment strategies and evaluate risk assessment outcomes for Chubb Limited (CB).
- Analysts: Enhance your analysis process with a ready-to-use, customizable risk assessment model.
- Small Business Owners: Understand how large insurance companies like Chubb Limited (CB) assess risks and opportunities.
What the Template Contains
- Pre-Filled Data: Includes Chubb Limited’s historical financials and forecasts.
- Discounted Cash Flow Model: Editable DCF valuation model with automatic calculations.
- Weighted Average Cost of Capital (WACC): A dedicated sheet for calculating WACC based on custom inputs.
- Key Financial Ratios: Analyze Chubb Limited’s profitability, efficiency, and leverage.
- Customizable Inputs: Edit revenue growth, margins, and tax rates with ease.
- Clear Dashboard: Charts and tables summarizing key valuation results.
Disclaimer
All information, articles, and product details provided on this website are for general informational and educational purposes only. We do not claim any ownership over, nor do we intend to infringe upon, any trademarks, copyrights, logos, brand names, or other intellectual property mentioned or depicted on this site. Such intellectual property remains the property of its respective owners, and any references here are made solely for identification or informational purposes, without implying any affiliation, endorsement, or partnership.
We make no representations or warranties, express or implied, regarding the accuracy, completeness, or suitability of any content or products presented. Nothing on this website should be construed as legal, tax, investment, financial, medical, or other professional advice. In addition, no part of this site—including articles or product references—constitutes a solicitation, recommendation, endorsement, advertisement, or offer to buy or sell any securities, franchises, or other financial instruments, particularly in jurisdictions where such activity would be unlawful.
All content is of a general nature and may not address the specific circumstances of any individual or entity. It is not a substitute for professional advice or services. Any actions you take based on the information provided here are strictly at your own risk. You accept full responsibility for any decisions or outcomes arising from your use of this website and agree to release us from any liability in connection with your use of, or reliance upon, the content or products found herein.