
|
Compagnie du Cambodge (cbdg.pa) Avaliação DCF |
Totalmente Editável: Adapte-Se Às Suas Necessidades No Excel Ou Planilhas
Design Profissional: Modelos Confiáveis E Padrão Da Indústria
Pré-Construídos Para Uso Rápido E Eficiente
Compatível com MAC/PC, totalmente desbloqueado
Não É Necessária Experiência; Fácil De Seguir
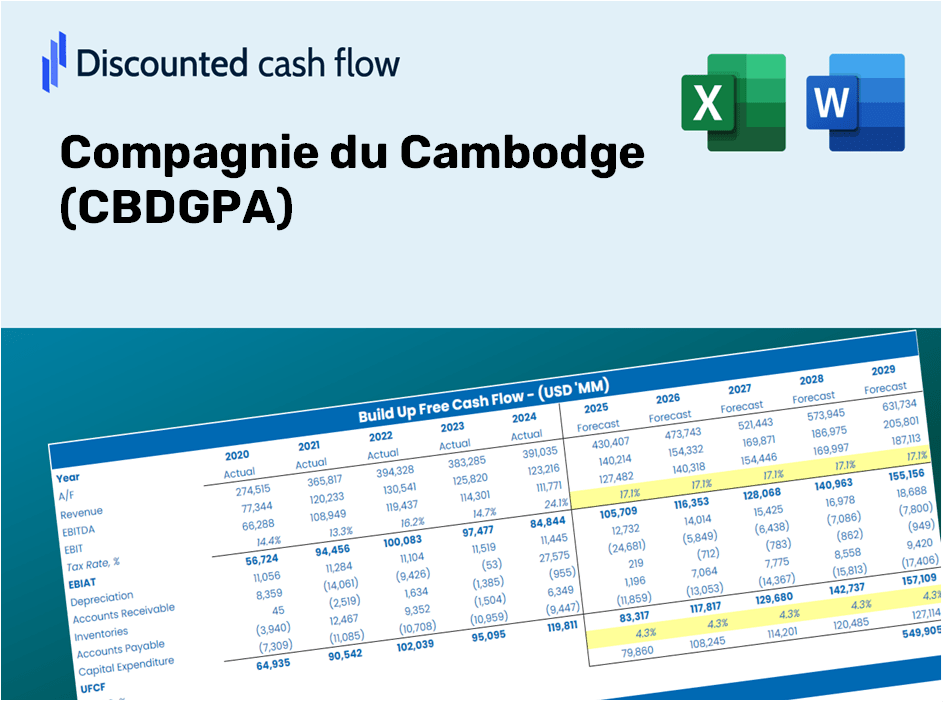
Compagnie du Cambodge (CBDG.PA) Bundle
Atualize sua análise e melhore a precisão com a nossa calculadora DCF (CBDGPA)! Equipado com dados genuínos do Compagnie du Cambodge e suposições personalizáveis, essa ferramenta permite que você preveja, analise e valorize o Compagnie du Cambodge como um investidor experiente.
Discounted Cash Flow (DCF) - (USD MM)
| Year | AY1 2020 |
AY2 2021 |
AY3 2022 |
AY4 2023 |
AY5 2024 |
FY1 2025 |
FY2 2026 |
FY3 2027 |
FY4 2028 |
FY5 2029 |
|---|---|---|---|---|---|---|---|---|---|---|
| Revenue | .2 | .2 | .2 | .2 | 31.3 | 39.1 | 48.9 | 61.1 | 76.4 | 95.5 |
| Revenue Growth, % | 0 | 0 | 0 | 0 | 15550 | 25 | 25 | 25 | 25 | 25 |
| EBITDA | 10.9 | 6.5 | -.5 | 42.3 | 56.6 | 23.5 | 29.3 | 36.7 | 45.8 | 57.3 |
| EBITDA, % | 5450 | 3250 | -250 | 21150 | 180.83 | 60 | 60 | 60 | 60 | 60 |
| Depreciation | -.1 | -.4 | .4 | 1.2 | .4 | 4.0 | 5.0 | 6.3 | 7.8 | 9.8 |
| Depreciation, % | -50 | -200 | 200 | 600 | 1.28 | 10.26 | 10.26 | 10.26 | 10.26 | 10.26 |
| EBIT | 11.0 | 6.9 | -.9 | 41.1 | 56.2 | 23.5 | 29.3 | 36.7 | 45.8 | 57.3 |
| EBIT, % | 5500 | 3450 | -450 | 20550 | 179.55 | 60 | 60 | 60 | 60 | 60 |
| Total Cash | 1,325.0 | 1,180.2 | 1,019.4 | 907.0 | 1,568.3 | 39.1 | 48.9 | 61.1 | 76.4 | 95.5 |
| Total Cash, percent | .7 | .6 | .5 | .5 | .0 | .0 | .0 | .0 | .0 | .0 |
| Account Receivables | 7.0 | .9 | .6 | .1 | 47.5 | 35.2 | 44.0 | 55.0 | 68.8 | 86.0 |
| Account Receivables, % | 3500 | 450 | 300 | 50 | 151.76 | 90 | 90 | 90 | 90 | 90 |
| Inventories | 6.0 | -.9 | -.6 | .0 | 27.2 | -1.0 | -1.3 | -1.6 | -2.0 | -2.5 |
| Inventories, % | 3000 | -450 | -300 | 0 | 86.9 | -2.62 | -2.62 | -2.62 | -2.62 | -2.62 |
| Accounts Payable | 8.9 | 2.1 | 2.0 | 2.1 | 21.8 | 36.8 | 45.9 | 57.4 | 71.8 | 89.7 |
| Accounts Payable, % | 4450 | 1050 | 1000 | 1050 | 69.65 | 93.93 | 93.93 | 93.93 | 93.93 | 93.93 |
| Capital Expenditure | -7.1 | -9.7 | .0 | .0 | -.5 | -15.8 | -19.7 | -24.6 | -30.8 | -38.5 |
| Capital Expenditure, % | -3550 | -4850 | 0 | 0 | -1.6 | -40.32 | -40.32 | -40.32 | -40.32 | -40.32 |
| Tax Rate, % | 18.25 | 18.25 | 18.25 | 18.25 | 18.25 | 18.25 | 18.25 | 18.25 | 18.25 | 18.25 |
| EBITAT | 8.1 | 12.8 | -.7 | 30.3 | 45.9 | 19.2 | 24.1 | 30.1 | 37.6 | 47.0 |
| Depreciation | ||||||||||
| Changes in Account Receivables | ||||||||||
| Changes in Inventories | ||||||||||
| Changes in Accounts Payable | ||||||||||
| Capital Expenditure | ||||||||||
| UFCF | -3.2 | 8.9 | -.4 | 31.5 | -9.1 | 62.9 | 10.0 | 12.5 | 15.6 | 19.5 |
| WACC, % | 4.14 | 4.61 | 4.27 | 4.14 | 4.28 | 4.29 | 4.29 | 4.29 | 4.29 | 4.29 |
| PV UFCF | ||||||||||
| SUM PV UFCF | 109.6 | |||||||||
| Long Term Growth Rate, % | 2.00 | |||||||||
| Free cash flow (T + 1) | 20 | |||||||||
| Terminal Value | 870 | |||||||||
| Present Terminal Value | 705 | |||||||||
| Enterprise Value | 815 | |||||||||
| Net Debt | -1,514 | |||||||||
| Equity Value | 2,328 | |||||||||
| Diluted Shares Outstanding, MM | 1 | |||||||||
| Equity Value Per Share | 4,159.71 |
What You Will Receive
- Pre-Configured Financial Model: Leverage Compagnie du Cambodge's (CBDGPA) actual data for accurate DCF valuations.
- Comprehensive Forecast Management: Adjust revenue growth, profit margins, WACC, and other essential parameters.
- Real-Time Calculations: Automatic updates ensure immediate visibility of results as modifications are made.
- Professional-Grade Template: A polished Excel file crafted for robust valuation processes.
- Flexible and Reusable: Designed for adaptability, facilitating repeated use to generate detailed forecasts.
Key Features
- 🔍 Real-Life CBDGPA Financials: Pre-filled historical and projected data for Compagnie du Cambodge.
- ✏️ Fully Customizable Inputs: Adjust all critical parameters (yellow cells) such as WACC, growth %, and tax rates.
- 📊 Professional DCF Valuation: Built-in formulas calculate Compagnie du Cambodge’s intrinsic value using the Discounted Cash Flow method.
- ⚡ Instant Results: Visualize Compagnie du Cambodge’s valuation immediately after making adjustments.
- Scenario Analysis: Test and compare outcomes for different financial assumptions side-by-side.
How It Functions
- Step 1: Download the Excel spreadsheet.
- Step 2: Examine the pre-filled data for Compagnie du Cambodge (CBDGPA) including historical and projected figures.
- Step 3: Modify the critical assumptions (highlighted in yellow) based on your analysis.
- Step 4: Observe the automatic updates for the intrinsic value of Compagnie du Cambodge (CBDGPA).
- Step 5: Utilize the results for your investment strategies or reporting purposes.
Why Opt for This Calculator?
- Precision: Authentic Compagnie du Cambodge (CBDGPA) financial data guarantees precise results.
- Versatility: Crafted for users to experiment with and adjust inputs effortlessly.
- Efficiency: Avoid the complexity of constructing a DCF model from the ground up.
- Professional Quality: Built with the accuracy and usability expected by CFOs.
- Intuitive Design: User-friendly interface suitable for those without expert financial modeling skills.
Who Can Benefit from Compagnie du Cambodge (CBDGPA)?
- Individual Investors: Make informed choices regarding your investments in Compagnie du Cambodge (CBDGPA).
- Financial Analysts: Enhance your valuation methodologies with ready-to-apply financial models for Compagnie du Cambodge (CBDGPA).
- Consultants: Provide clients with swift and precise valuation insights related to Compagnie du Cambodge (CBDGPA).
- Business Owners: Gain an understanding of how companies like Compagnie du Cambodge (CBDGPA) are valued to inform your own business strategies.
- Finance Students: Explore valuation techniques through practical data and case studies involving Compagnie du Cambodge (CBDGPA).
What the Template Contains
- Historical Data: Comprehensive records of Compagnie du Cambodge’s past financial performance and baseline forecasts.
- DCF and Levered DCF Models: In-depth templates to assess the intrinsic value of Compagnie du Cambodge (CBDGPA).
- WACC Sheet: Ready-made calculations for the Weighted Average Cost of Capital.
- Editable Inputs: Customize essential parameters such as growth rates, EBITDA percentage, and CAPEX assumptions.
- Quarterly and Annual Statements: An extensive analysis of Compagnie du Cambodge’s financial statements.
- Interactive Dashboard: A dynamic interface to visualize valuation results and forecasts.
Disclaimer
All information, articles, and product details provided on this website are for general informational and educational purposes only. We do not claim any ownership over, nor do we intend to infringe upon, any trademarks, copyrights, logos, brand names, or other intellectual property mentioned or depicted on this site. Such intellectual property remains the property of its respective owners, and any references here are made solely for identification or informational purposes, without implying any affiliation, endorsement, or partnership.
We make no representations or warranties, express or implied, regarding the accuracy, completeness, or suitability of any content or products presented. Nothing on this website should be construed as legal, tax, investment, financial, medical, or other professional advice. In addition, no part of this site—including articles or product references—constitutes a solicitation, recommendation, endorsement, advertisement, or offer to buy or sell any securities, franchises, or other financial instruments, particularly in jurisdictions where such activity would be unlawful.
All content is of a general nature and may not address the specific circumstances of any individual or entity. It is not a substitute for professional advice or services. Any actions you take based on the information provided here are strictly at your own risk. You accept full responsibility for any decisions or outcomes arising from your use of this website and agree to release us from any liability in connection with your use of, or reliance upon, the content or products found herein.