
|
Avaliação DCF da Cabot Corporation (CBT) |
Totalmente Editável: Adapte-Se Às Suas Necessidades No Excel Ou Planilhas
Design Profissional: Modelos Confiáveis E Padrão Da Indústria
Pré-Construídos Para Uso Rápido E Eficiente
Compatível com MAC/PC, totalmente desbloqueado
Não É Necessária Experiência; Fácil De Seguir
Cabot Corporation (CBT) Bundle
Seja você um investidor ou analista, esta calculadora DCF [símbolo] é a ferramenta perfeita para uma avaliação precisa. Com dados reais da Cabot Corporation (TCC) já incluídos, você pode ajustar as previsões e observar imediatamente os efeitos.
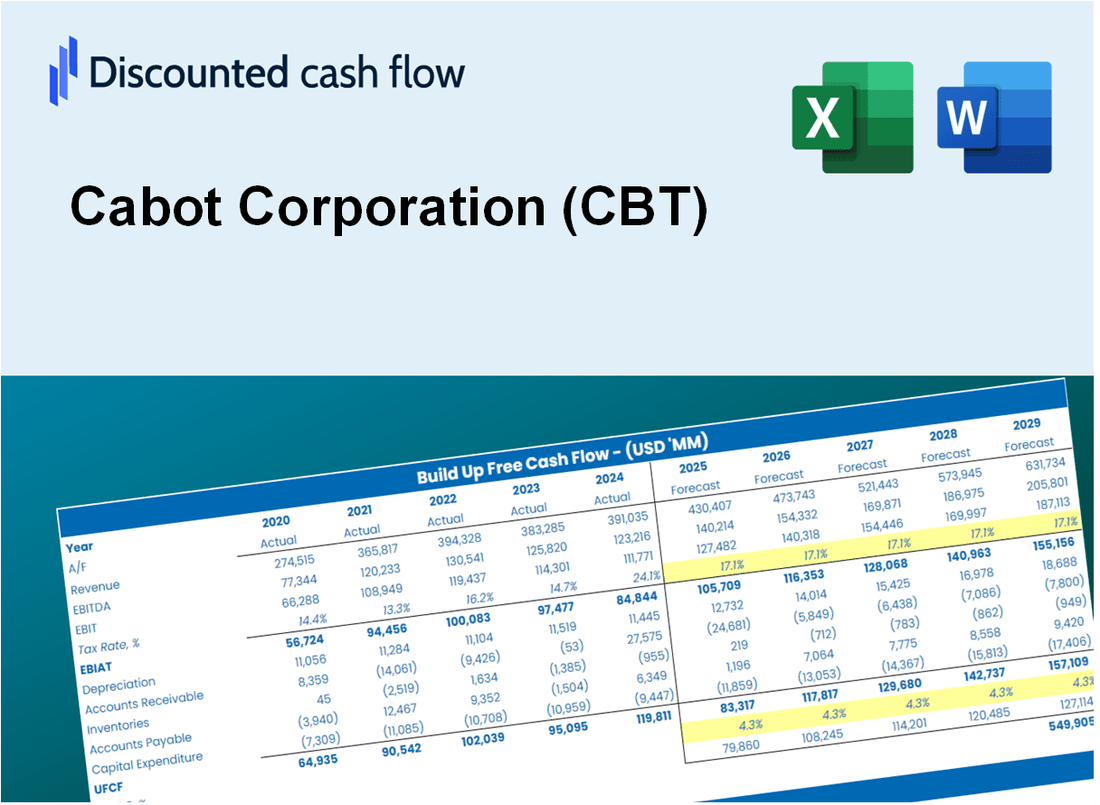
Discounted Cash Flow (DCF) - (USD MM)
| Year | AY1 2020 |
AY2 2021 |
AY3 2022 |
AY4 2023 |
AY5 2024 |
FY1 2025 |
FY2 2026 |
FY3 2027 |
FY4 2028 |
FY5 2029 |
|---|---|---|---|---|---|---|---|---|---|---|
| Revenue | 2,614.0 | 3,409.0 | 4,321.0 | 3,931.0 | 3,994.0 | 4,490.7 | 5,049.1 | 5,677.0 | 6,383.0 | 7,176.8 |
| Revenue Growth, % | 0 | 30.41 | 26.75 | -9.03 | 1.6 | 12.44 | 12.44 | 12.44 | 12.44 | 12.44 |
| EBITDA | 306.0 | 615.0 | 537.0 | 685.0 | 761.0 | 706.4 | 794.3 | 893.0 | 1,004.1 | 1,129.0 |
| EBITDA, % | 11.71 | 18.04 | 12.43 | 17.43 | 19.05 | 15.73 | 15.73 | 15.73 | 15.73 | 15.73 |
| Depreciation | 158.0 | 160.0 | 146.0 | 144.0 | 151.0 | 193.6 | 217.7 | 244.8 | 275.2 | 309.5 |
| Depreciation, % | 6.04 | 4.69 | 3.38 | 3.66 | 3.78 | 4.31 | 4.31 | 4.31 | 4.31 | 4.31 |
| EBIT | 148.0 | 455.0 | 391.0 | 541.0 | 610.0 | 512.8 | 576.5 | 648.2 | 728.8 | 819.5 |
| EBIT, % | 5.66 | 13.35 | 9.05 | 13.76 | 15.27 | 11.42 | 11.42 | 11.42 | 11.42 | 11.42 |
| Total Cash | 151.0 | 168.0 | 206.0 | 238.0 | 223.0 | 243.5 | 273.8 | 307.8 | 346.1 | 389.1 |
| Total Cash, percent | .0 | .0 | .0 | .0 | .0 | .0 | .0 | .0 | .0 | .0 |
| Account Receivables | 418.0 | 645.0 | 836.0 | 695.0 | 733.0 | 810.9 | 911.8 | 1,025.2 | 1,152.7 | 1,296.0 |
| Account Receivables, % | 15.99 | 18.92 | 19.35 | 17.68 | 18.35 | 18.06 | 18.06 | 18.06 | 18.06 | 18.06 |
| Inventories | 359.0 | 523.0 | 664.0 | 585.0 | 552.0 | 656.9 | 738.6 | 830.5 | 933.8 | 1,049.9 |
| Inventories, % | 13.73 | 15.34 | 15.37 | 14.88 | 13.82 | 14.63 | 14.63 | 14.63 | 14.63 | 14.63 |
| Accounts Payable | 316.0 | 480.0 | 533.0 | 438.0 | 676.0 | 597.9 | 672.3 | 755.9 | 849.9 | 955.5 |
| Accounts Payable, % | 12.09 | 14.08 | 12.34 | 11.14 | 16.93 | 13.31 | 13.31 | 13.31 | 13.31 | 13.31 |
| Capital Expenditure | -200.0 | -195.0 | -211.0 | -244.0 | -241.0 | -273.9 | -308.0 | -346.2 | -389.3 | -437.7 |
| Capital Expenditure, % | -7.65 | -5.72 | -4.88 | -6.21 | -6.03 | -6.1 | -6.1 | -6.1 | -6.1 | -6.1 |
| Tax Rate, % | 28.97 | 28.97 | 28.97 | 28.97 | 28.97 | 28.97 | 28.97 | 28.97 | 28.97 | 28.97 |
| EBITAT | 1,004.6 | 278.1 | 236.9 | 527.9 | 433.3 | 400.3 | 450.1 | 506.0 | 569.0 | 639.7 |
| Depreciation | ||||||||||
| Changes in Account Receivables | ||||||||||
| Changes in Inventories | ||||||||||
| Changes in Accounts Payable | ||||||||||
| Capital Expenditure | ||||||||||
| UFCF | 501.6 | 16.1 | -107.1 | 552.9 | 576.3 | 59.1 | 251.7 | 283.0 | 318.1 | 357.7 |
| WACC, % | 7.73 | 7.04 | 7.03 | 7.69 | 7.22 | 7.34 | 7.34 | 7.34 | 7.34 | 7.34 |
| PV UFCF | ||||||||||
| SUM PV UFCF | 992.8 | |||||||||
| Long Term Growth Rate, % | 2.00 | |||||||||
| Free cash flow (T + 1) | 365 | |||||||||
| Terminal Value | 6,828 | |||||||||
| Present Terminal Value | 4,791 | |||||||||
| Enterprise Value | 5,783 | |||||||||
| Net Debt | 917 | |||||||||
| Equity Value | 4,866 | |||||||||
| Diluted Shares Outstanding, MM | 56 | |||||||||
| Equity Value Per Share | 87.37 |
What You Will Get
- Editable Excel Template: A fully customizable Excel-based DCF Calculator featuring pre-filled real CBT financials.
- Real-World Data: Access to historical data and forward-looking estimates (highlighted in the yellow cells).
- Forecast Flexibility: Adjust forecast assumptions such as revenue growth, EBITDA %, and WACC.
- Automatic Calculations: Instantly observe how your inputs affect Cabot Corporation’s valuation.
- Professional Tool: Designed for investors, CFOs, consultants, and financial analysts.
- User-Friendly Design: Organized for clarity and ease of use, complete with step-by-step instructions.
Key Features
- Comprehensive DCF Calculator: Features detailed unlevered and levered DCF valuation models tailored for Cabot Corporation (CBT).
- WACC Calculator: Ready-to-use Weighted Average Cost of Capital sheet with adjustable parameters.
- Customizable Forecast Assumptions: Adjust growth projections, capital expenditures, and discount rates as needed.
- Integrated Financial Ratios: Evaluate profitability, leverage, and efficiency ratios specifically for Cabot Corporation (CBT).
- Interactive Dashboard and Charts: Visual representations highlight essential valuation metrics for straightforward analysis.
How It Works
- Step 1: Download the Excel file.
- Step 2: Review Cabot Corporation's (CBT) pre-filled financial data and forecasts.
- Step 3: Modify key inputs such as revenue growth, WACC, and tax rates (highlighted cells).
- Step 4: Watch the DCF model update in real-time as you adjust your assumptions.
- Step 5: Analyze the outputs and utilize the results for your investment decisions.
Why Choose This Calculator for Cabot Corporation (CBT)?
- All-in-One Solution: Features DCF, WACC, and financial ratio analyses tailored for Cabot Corporation (CBT).
- Flexible Inputs: Modify the highlighted cells to explore different financial scenarios.
- In-Depth Analysis: Automatically computes Cabot Corporation’s (CBT) intrinsic value and Net Present Value.
- Preloaded Information: Access historical and projected data for precise analysis.
- Expert-Level Tool: Perfect for financial analysts, investors, and business consultants focusing on Cabot Corporation (CBT).
Who Should Use This Product?
- Investors: Evaluate Cabot Corporation’s (CBT) valuation prior to making investment decisions.
- CFOs and Financial Analysts: Optimize valuation methodologies and assess financial forecasts.
- Startup Founders: Gain insights into the valuation practices of established companies like Cabot Corporation.
- Consultants: Provide detailed valuation analyses and reports for clients in need.
- Students and Educators: Utilize real market data to enhance learning and practice valuation skills.
What the Template Contains
- Preloaded CBT Data: Historical and projected financial data, including revenue, EBIT, and capital expenditures.
- DCF and WACC Models: Professional-grade sheets for calculating intrinsic value and Weighted Average Cost of Capital.
- Editable Inputs: Yellow-highlighted cells for adjusting revenue growth, tax rates, and discount rates.
- Financial Statements: Comprehensive annual and quarterly financials for deeper analysis.
- Key Ratios: Profitability, leverage, and efficiency ratios to evaluate performance.
- Dashboard and Charts: Visual summaries of valuation outcomes and assumptions.
Disclaimer
All information, articles, and product details provided on this website are for general informational and educational purposes only. We do not claim any ownership over, nor do we intend to infringe upon, any trademarks, copyrights, logos, brand names, or other intellectual property mentioned or depicted on this site. Such intellectual property remains the property of its respective owners, and any references here are made solely for identification or informational purposes, without implying any affiliation, endorsement, or partnership.
We make no representations or warranties, express or implied, regarding the accuracy, completeness, or suitability of any content or products presented. Nothing on this website should be construed as legal, tax, investment, financial, medical, or other professional advice. In addition, no part of this site—including articles or product references—constitutes a solicitation, recommendation, endorsement, advertisement, or offer to buy or sell any securities, franchises, or other financial instruments, particularly in jurisdictions where such activity would be unlawful.
All content is of a general nature and may not address the specific circumstances of any individual or entity. It is not a substitute for professional advice or services. Any actions you take based on the information provided here are strictly at your own risk. You accept full responsibility for any decisions or outcomes arising from your use of this website and agree to release us from any liability in connection with your use of, or reliance upon, the content or products found herein.