
|
Banco Central da Índia (Centralbk.NS) Avaliação DCF |
Totalmente Editável: Adapte-Se Às Suas Necessidades No Excel Ou Planilhas
Design Profissional: Modelos Confiáveis E Padrão Da Indústria
Pré-Construídos Para Uso Rápido E Eficiente
Compatível com MAC/PC, totalmente desbloqueado
Não É Necessária Experiência; Fácil De Seguir
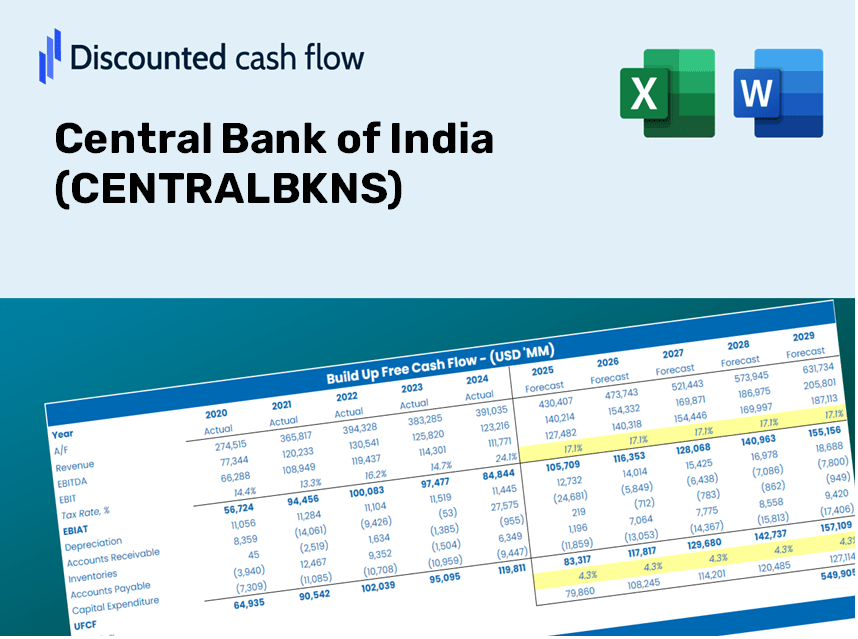
Central Bank of India (CENTRALBK.NS) Bundle
Procurando avaliar o valor intrínseco do Banco Central da Índia? Nossa calculadora CentralbKNS DCF integra dados do mundo real com recursos abrangentes de personalização, permitindo refinar suas previsões e aprimorar suas opções de investimento.
Discounted Cash Flow (DCF) - (USD MM)
| Year | AY1 2021 |
AY2 2022 |
AY3 2023 |
AY4 2024 |
AY5 2025 |
FY1 2026 |
FY2 2027 |
FY3 2028 |
FY4 2029 |
FY5 2030 |
|---|---|---|---|---|---|---|---|---|---|---|
| Revenue | 259,612.9 | 83,415.7 | 297,404.5 | 355,766.5 | 396,679.5 | 459,408.9 | 532,058.2 | 616,195.9 | 713,638.9 | 826,491.1 |
| Revenue Growth, % | 0 | -67.87 | 256.53 | 19.62 | 11.5 | 15.81 | 15.81 | 15.81 | 15.81 | 15.81 |
| EBITDA | -12,880.2 | 20,415.8 | 30,680.1 | 31,764.5 | 45,007.8 | 46,036.4 | 53,316.4 | 61,747.7 | 71,512.2 | 82,820.9 |
| EBITDA, % | -4.96 | 24.47 | 10.32 | 8.93 | 11.35 | 10.02 | 10.02 | 10.02 | 10.02 | 10.02 |
| Depreciation | .0 | 2,967.6 | 3,859.8 | 4,998.3 | 5,575.7 | 7,043.7 | 8,157.5 | 9,447.5 | 10,941.5 | 12,671.8 |
| Depreciation, % | 0 | 3.56 | 1.3 | 1.4 | 1.41 | 1.53 | 1.53 | 1.53 | 1.53 | 1.53 |
| EBIT | -12,880.2 | 17,448.1 | 26,820.3 | 26,766.2 | 39,432.1 | 38,992.7 | 45,158.9 | 52,300.2 | 60,570.7 | 70,149.1 |
| EBIT, % | -4.96 | 20.92 | 9.02 | 7.52 | 9.94 | 8.49 | 8.49 | 8.49 | 8.49 | 8.49 |
| Total Cash | 389,537.7 | 530,969.4 | 441,019.4 | 376,078.0 | 361,974.0 | 451,370.2 | 522,748.2 | 605,413.7 | 701,151.6 | 812,029.2 |
| Total Cash, percent | .0 | .0 | .0 | .0 | .0 | .0 | .0 | .0 | .0 | .0 |
| Account Receivables | 31,455.4 | 45,817.7 | 50,955.5 | 47,881.4 | 58,201.4 | 103,190.0 | 119,508.1 | 138,406.7 | 160,293.9 | 185,642.1 |
| Account Receivables, % | 12.12 | 54.93 | 17.13 | 13.46 | 14.67 | 22.46 | 22.46 | 22.46 | 22.46 | 22.46 |
| Inventories | .0 | -638,209.1 | -503,698.4 | 328,196.6 | .0 | -99,002.1 | -114,657.9 | -132,789.5 | -153,788.4 | -178,107.9 |
| Inventories, % | 0 | -765.09 | -169.36 | 92.25 | 0 | -21.55 | -21.55 | -21.55 | -21.55 | -21.55 |
| Accounts Payable | 7,443.9 | 7,745.8 | 8,915.7 | 6,493.8 | 7,938.7 | 17,436.9 | 20,194.3 | 23,387.8 | 27,086.2 | 31,369.6 |
| Accounts Payable, % | 2.87 | 9.29 | 3 | 1.83 | 2 | 3.8 | 3.8 | 3.8 | 3.8 | 3.8 |
| Capital Expenditure | -2,051.7 | -1,577.6 | -2,122.8 | -5,872.5 | -4,552.1 | -5,690.7 | -6,590.6 | -7,632.9 | -8,839.9 | -10,237.8 |
| Capital Expenditure, % | -0.79029 | -1.89 | -0.71378 | -1.65 | -1.15 | -1.24 | -1.24 | -1.24 | -1.24 | -1.24 |
| Tax Rate, % | 0.22822 | 0.22822 | 0.22822 | 0.22822 | 0.22822 | 0.22822 | 0.22822 | 0.22822 | 0.22822 | 0.22822 |
| EBITAT | -7,985.3 | 10,645.3 | 26,667.6 | 26,676.8 | 39,342.1 | 32,900.2 | 38,102.9 | 44,128.4 | 51,106.7 | 59,188.5 |
| Depreciation | ||||||||||
| Changes in Account Receivables | ||||||||||
| Changes in Inventories | ||||||||||
| Changes in Accounts Payable | ||||||||||
| Capital Expenditure | ||||||||||
| UFCF | -34,048.4 | 636,184.2 | -110,074.1 | -805,440.1 | 359,687.1 | 97,764.9 | 41,765.0 | 48,369.5 | 56,018.5 | 64,877.1 |
| WACC, % | 25.37 | 25.02 | 38.73 | 38.82 | 38.86 | 33.36 | 33.36 | 33.36 | 33.36 | 33.36 |
| PV UFCF | ||||||||||
| SUM PV UFCF | 150,280.0 | |||||||||
| Long Term Growth Rate, % | 2.00 | |||||||||
| Free cash flow (T + 1) | 66,175 | |||||||||
| Terminal Value | 211,025 | |||||||||
| Present Terminal Value | 50,030 | |||||||||
| Enterprise Value | 200,310 | |||||||||
| Net Debt | -143,778 | |||||||||
| Equity Value | 344,087 | |||||||||
| Diluted Shares Outstanding, MM | 8,681 | |||||||||
| Equity Value Per Share | 39.64 |
What You Will Receive
- Authentic CENTRALBKNS Financial Data: Pre-loaded with the Central Bank of India's historical and forecasted data for accurate assessments.
- Customizable Template: Easily adjust essential parameters such as revenue growth, WACC, and EBITDA margin.
- Real-Time Calculations: Instantly view updates to the intrinsic value of CENTRALBKNS based on your modifications.
- Expert Valuation Tool: Tailored for investors, analysts, and consultants aiming for precise DCF analyses.
- Intuitive Design: Streamlined layout and straightforward guidelines suitable for all skill levels.
Key Features
- Advanced DCF Calculator: Comprehensive unlevered and levered DCF valuation models tailored for Central Bank of India (CENTRALBKNS).
- WACC Calculator: Ready-to-use Weighted Average Cost of Capital sheet featuring customizable parameters.
- Editable Forecast Assumptions: Adjust growth rates, capital expenditures, and discount rates as needed.
- Built-In Financial Ratios: Evaluate profitability, leverage, and efficiency ratios specifically for Central Bank of India (CENTRALBKNS).
- Dashboard and Visual Charts: Intuitive visual representations highlight essential valuation metrics for straightforward analysis.
How It Works
- Step 1: Download the Excel file for Central Bank of India (CENTRALBKNS).
- Step 2: Examine the pre-loaded financial data and projections for Central Bank of India (CENTRALBKNS).
- Step 3: Adjust key inputs such as revenue growth, WACC, and tax rates (highlighted cells).
- Step 4: Observe the DCF model refresh in real-time as you modify your assumptions.
- Step 5: Evaluate the results and leverage the insights for your investment strategies.
Why Choose the Central Bank of India (CENTRALBKNS) Calculator?
- Precision: Utilizes authentic Central Bank of India financial data for reliable results.
- Adaptability: Built to allow users to easily test and adjust inputs as needed.
- Efficiency: Avoid the complexities of creating a financial model from the ground up.
- Expert Quality: Crafted with the expertise and usability expected by financial leaders.
- Accessibility: Intuitive interface, ideal for users lacking extensive financial modeling skills.
Who Can Benefit from This Product?
- Investors: Evaluate the valuation of Central Bank of India (CENTRALBKNS) prior to trading decisions.
- CFOs and Financial Analysts: Enhance the efficiency of valuation methodologies and validate financial forecasts.
- Startup Founders: Gain insights into how established banks like Central Bank of India (CENTRALBKNS) are appraised.
- Consultants: Prepare comprehensive valuation reports for your clientele.
- Students and Educators: Utilize actual data to practice and instruct on valuation principles.
Contents of the Template
- Pre-Filled Data: Contains Central Bank of India's historical financial data and projections.
- Discounted Cash Flow Model: An editable DCF valuation model featuring automated calculations.
- Weighted Average Cost of Capital (WACC): A separate sheet for calculating WACC using custom inputs.
- Key Financial Ratios: Evaluate Central Bank of India's profitability, efficiency, and financial leverage.
- Customizable Inputs: Easily adjust revenue growth, profit margins, and tax rates.
- Clear Dashboard: Visual representations such as charts and tables summarizing essential valuation outcomes.
Disclaimer
All information, articles, and product details provided on this website are for general informational and educational purposes only. We do not claim any ownership over, nor do we intend to infringe upon, any trademarks, copyrights, logos, brand names, or other intellectual property mentioned or depicted on this site. Such intellectual property remains the property of its respective owners, and any references here are made solely for identification or informational purposes, without implying any affiliation, endorsement, or partnership.
We make no representations or warranties, express or implied, regarding the accuracy, completeness, or suitability of any content or products presented. Nothing on this website should be construed as legal, tax, investment, financial, medical, or other professional advice. In addition, no part of this site—including articles or product references—constitutes a solicitation, recommendation, endorsement, advertisement, or offer to buy or sell any securities, franchises, or other financial instruments, particularly in jurisdictions where such activity would be unlawful.
All content is of a general nature and may not address the specific circumstances of any individual or entity. It is not a substitute for professional advice or services. Any actions you take based on the information provided here are strictly at your own risk. You accept full responsibility for any decisions or outcomes arising from your use of this website and agree to release us from any liability in connection with your use of, or reliance upon, the content or products found herein.