
|
Century Plyboards Limited (Centuryply.NS) Avaliação DCF |
Totalmente Editável: Adapte-Se Às Suas Necessidades No Excel Ou Planilhas
Design Profissional: Modelos Confiáveis E Padrão Da Indústria
Pré-Construídos Para Uso Rápido E Eficiente
Compatível com MAC/PC, totalmente desbloqueado
Não É Necessária Experiência; Fácil De Seguir
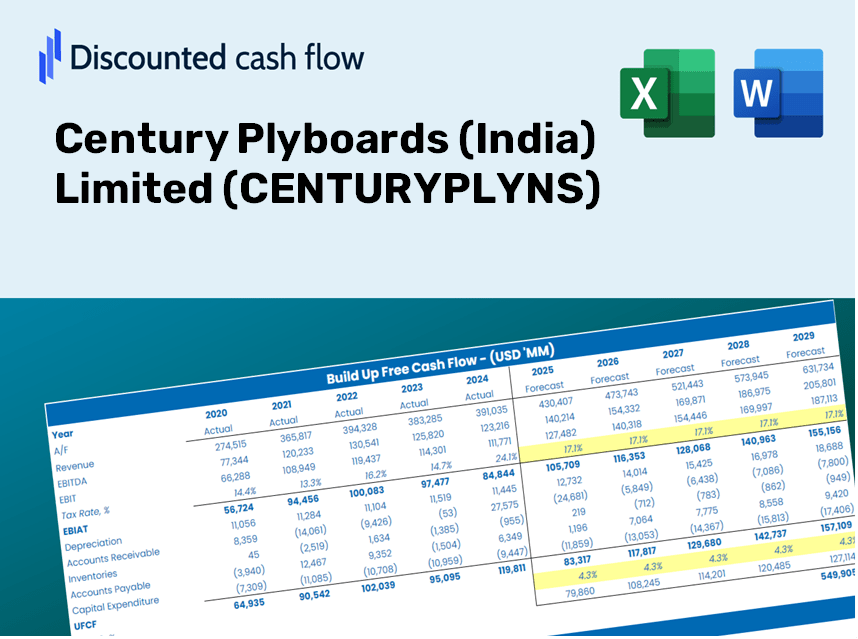
Century Plyboards (India) Limited (CENTURYPLY.NS) Bundle
Simplifique sua análise e melhore a precisão com a calculadora DCF (CenturyPlyns)! Usando dados autênticos da Century Plyboards (Índia), suposições limitadas e personalizáveis, essa ferramenta capacita você a prever, analisar e avaliar centuripos como um investidor experiente.
Discounted Cash Flow (DCF) - (USD MM)
| Year | AY1 2021 |
AY2 2022 |
AY3 2023 |
AY4 2024 |
AY5 2025 |
FY1 2026 |
FY2 2027 |
FY3 2028 |
FY4 2029 |
FY5 2030 |
|---|---|---|---|---|---|---|---|---|---|---|
| Revenue | 21,196.2 | 30,087.1 | 36,465.7 | 38,859.5 | 45,278.0 | 55,038.6 | 66,903.2 | 81,325.4 | 98,856.7 | 120,167.1 |
| Revenue Growth, % | 0 | 41.95 | 21.2 | 6.56 | 16.52 | 21.56 | 21.56 | 21.56 | 21.56 | 21.56 |
| EBITDA | 3,416.0 | 5,513.8 | 6,012.6 | 5,653.4 | 4,835.0 | 8,383.2 | 10,190.4 | 12,387.1 | 15,057.4 | 18,303.3 |
| EBITDA, % | 16.12 | 18.33 | 16.49 | 14.55 | 10.68 | 15.23 | 15.23 | 15.23 | 15.23 | 15.23 |
| Depreciation | 686.5 | 742.8 | 775.1 | 1,005.9 | 1,371.9 | 1,480.7 | 1,799.9 | 2,187.9 | 2,659.5 | 3,232.9 |
| Depreciation, % | 3.24 | 2.47 | 2.13 | 2.59 | 3.03 | 2.69 | 2.69 | 2.69 | 2.69 | 2.69 |
| EBIT | 2,729.5 | 4,771.0 | 5,237.6 | 4,647.6 | 3,463.1 | 6,902.5 | 8,390.5 | 10,199.2 | 12,397.8 | 15,070.4 |
| EBIT, % | 12.88 | 15.86 | 14.36 | 11.96 | 7.65 | 12.54 | 12.54 | 12.54 | 12.54 | 12.54 |
| Total Cash | 1,996.6 | 2,570.2 | 2,601.8 | 412.2 | 905.6 | 3,099.6 | 3,767.7 | 4,579.9 | 5,567.2 | 6,767.3 |
| Total Cash, percent | .0 | .0 | .0 | .0 | .0 | .0 | .0 | .0 | .0 | .0 |
| Account Receivables | 3,026.8 | 3,966.1 | 3,903.4 | 4,167.9 | 5,072.8 | 6,615.1 | 8,041.2 | 9,774.6 | 11,881.7 | 14,443.0 |
| Account Receivables, % | 14.28 | 13.18 | 10.7 | 10.73 | 11.2 | 12.02 | 12.02 | 12.02 | 12.02 | 12.02 |
| Inventories | 3,691.7 | 5,263.9 | 5,289.7 | 6,456.0 | 9,865.5 | 9,667.1 | 11,751.0 | 14,284.1 | 17,363.4 | 21,106.4 |
| Inventories, % | 17.42 | 17.5 | 14.51 | 16.61 | 21.79 | 17.56 | 17.56 | 17.56 | 17.56 | 17.56 |
| Accounts Payable | 2,088.5 | 2,527.9 | 2,748.6 | 2,861.1 | 3,571.8 | 4,518.0 | 5,491.9 | 6,675.8 | 8,114.9 | 9,864.2 |
| Accounts Payable, % | 9.85 | 8.4 | 7.54 | 7.36 | 7.89 | 8.21 | 8.21 | 8.21 | 8.21 | 8.21 |
| Capital Expenditure | -638.9 | -2,825.7 | -4,906.5 | -8,500.5 | -6,653.3 | -6,872.2 | -8,353.6 | -10,154.3 | -12,343.3 | -15,004.1 |
| Capital Expenditure, % | -3.01 | -9.39 | -13.46 | -21.87 | -14.69 | -12.49 | -12.49 | -12.49 | -12.49 | -12.49 |
| Tax Rate, % | 33.17 | 33.17 | 33.17 | 33.17 | 33.17 | 33.17 | 33.17 | 33.17 | 33.17 | 33.17 |
| EBITAT | 2,013.3 | 3,190.0 | 3,849.6 | 3,454.1 | 2,314.5 | 4,904.6 | 5,961.9 | 7,247.1 | 8,809.4 | 10,708.4 |
| Depreciation | ||||||||||
| Changes in Account Receivables | ||||||||||
| Changes in Inventories | ||||||||||
| Changes in Accounts Payable | ||||||||||
| Capital Expenditure | ||||||||||
| UFCF | -2,569.1 | -965.0 | -24.2 | -5,358.7 | -6,570.7 | -884.5 | -3,127.8 | -3,802.0 | -4,621.6 | -5,617.9 |
| WACC, % | 5.07 | 5.05 | 5.07 | 5.07 | 5.05 | 5.06 | 5.06 | 5.06 | 5.06 | 5.06 |
| PV UFCF | ||||||||||
| SUM PV UFCF | -15,135.9 | |||||||||
| Long Term Growth Rate, % | 4.00 | |||||||||
| Free cash flow (T + 1) | -5,843 | |||||||||
| Terminal Value | -550,064 | |||||||||
| Present Terminal Value | -429,716 | |||||||||
| Enterprise Value | -444,852 | |||||||||
| Net Debt | 15,661 | |||||||||
| Equity Value | -460,513 | |||||||||
| Diluted Shares Outstanding, MM | 222 | |||||||||
| Equity Value Per Share | -2,072.46 |
What You Will Receive
- Customizable Excel Template: A versatile Excel-based DCF Calculator featuring pre-loaded financial data for CENTURYPLYNS.
- Accurate Market Data: Access to historical figures and future projections (highlighted in the yellow cells).
- Adaptable Forecasts: Modify key assumptions such as revenue growth, EBITDA %, and WACC at your discretion.
- Instant Calculations: Observe the effects of your inputs on the valuation of Century Plyboards in real-time.
- Professional Grade Tool: Designed for investors, CFOs, consultants, and financial analysts.
- Intuitive User Interface: Organized for simplicity and convenience, complete with detailed instructions.
Key Features
- Comprehensive DCF Calculator: Features both unlevered and levered DCF valuation models tailored for Century Plyboards (India) Limited (CENTURYPLYNS).
- WACC Calculator: Includes a pre-configured Weighted Average Cost of Capital sheet with adjustable parameters.
- Customizable Forecast Assumptions: Easily adjust growth rates, capital expenditures, and discount rates to suit your analysis.
- Integrated Financial Ratios: Assess profitability, leverage, and efficiency ratios specifically for Century Plyboards (India) Limited (CENTURYPLYNS).
- Interactive Dashboard and Charts: Visual representations that encapsulate essential valuation metrics for straightforward interpretation.
How It Functions
- Step 1: Download the Excel spreadsheet.
- Step 2: Examine the pre-filled data for Century Plyboards (India) Limited (CENTURYPLYNS) encompassing both historical figures and future projections.
- Step 3: Modify the key assumptions (highlighted in yellow) according to your evaluation.
- Step 4: Observe the automatic updates reflecting the intrinsic value of Century Plyboards (India) Limited (CENTURYPLYNS).
- Step 5: Utilize the results for making investment choices or for reporting purposes.
Why Choose Century Plyboards (CENTURYPLYNS) Calculator?
- Save Time: Eliminate the hassle of building a DCF model from scratch – it’s ready for immediate use.
- Enhance Accuracy: Dependable financial data and formulas minimize valuation errors.
- Fully Customizable: Adjust the model to align with your specific assumptions and forecasts.
- Easy to Understand: User-friendly charts and outputs simplify result analysis.
- Backed by Professionals: Crafted for experts who prioritize precision and functionality.
Who Can Benefit from Century Plyboards (India) Limited (CENTURYPLYNS)?
- Investors: Make informed choices with our advanced valuation tools tailored for the industry.
- Financial Analysts: Enhance efficiency with a ready-to-customize DCF model designed for your needs.
- Consultants: Seamlessly modify the template for impactful client presentations and comprehensive reports.
- Finance Enthusiasts: Expand your knowledge of valuation methods through real-life case studies.
- Educators and Students: Utilize this as a hands-on resource in finance-related coursework.
What the Template Contains
- Preloaded CENTURYPLYNS Data: Historical and projected financial information, including revenue, EBIT, and capital expenditures.
- DCF and WACC Models: Professional-grade spreadsheets designed for calculating intrinsic value and Weighted Average Cost of Capital.
- Editable Inputs: Yellow-highlighted cells that allow for adjustments to revenue growth, tax rates, and discount rates.
- Financial Statements: Detailed annual and quarterly financials for in-depth analysis.
- Key Ratios: Evaluative metrics including profitability, leverage, and efficiency ratios.
- Dashboard and Charts: Visual representations of valuation outcomes and underlying assumptions.
Disclaimer
All information, articles, and product details provided on this website are for general informational and educational purposes only. We do not claim any ownership over, nor do we intend to infringe upon, any trademarks, copyrights, logos, brand names, or other intellectual property mentioned or depicted on this site. Such intellectual property remains the property of its respective owners, and any references here are made solely for identification or informational purposes, without implying any affiliation, endorsement, or partnership.
We make no representations or warranties, express or implied, regarding the accuracy, completeness, or suitability of any content or products presented. Nothing on this website should be construed as legal, tax, investment, financial, medical, or other professional advice. In addition, no part of this site—including articles or product references—constitutes a solicitation, recommendation, endorsement, advertisement, or offer to buy or sell any securities, franchises, or other financial instruments, particularly in jurisdictions where such activity would be unlawful.
All content is of a general nature and may not address the specific circumstances of any individual or entity. It is not a substitute for professional advice or services. Any actions you take based on the information provided here are strictly at your own risk. You accept full responsibility for any decisions or outcomes arising from your use of this website and agree to release us from any liability in connection with your use of, or reliance upon, the content or products found herein.