
|
Century Aluminium Company (CENX) Avaliação DCF |
Totalmente Editável: Adapte-Se Às Suas Necessidades No Excel Ou Planilhas
Design Profissional: Modelos Confiáveis E Padrão Da Indústria
Pré-Construídos Para Uso Rápido E Eficiente
Compatível com MAC/PC, totalmente desbloqueado
Não É Necessária Experiência; Fácil De Seguir
Century Aluminum Company (CENX) Bundle
Explore as perspectivas financeiras da Century Aluminium Company (CENX) usando nossa calculadora DCF amigável! Digite suas projeções de crescimento, margens e despesas para determinar o valor intrínseco da Century Aluminium Company (CENX) e refine sua abordagem de investimento.
What You Will Receive
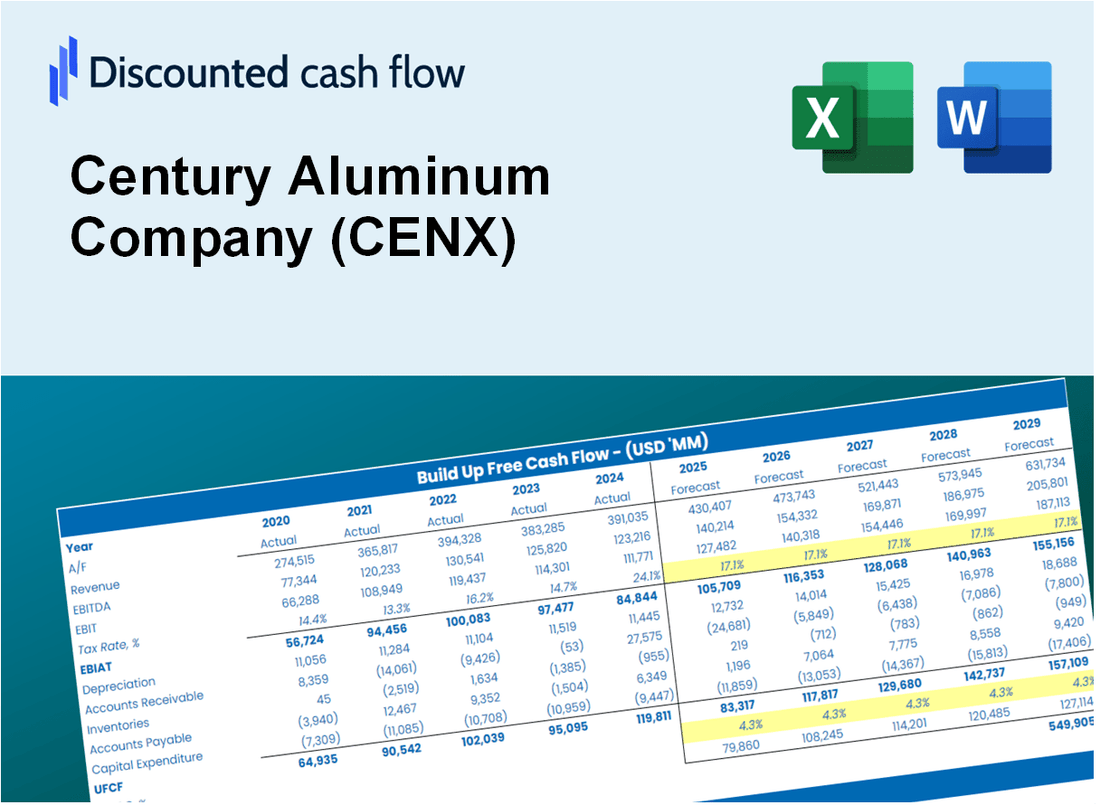
- Pre-Filled Financial Model: Century Aluminum Company’s actual data allows for accurate DCF valuation.
- Comprehensive Forecast Control: Modify revenue growth, profit margins, WACC, and other essential factors.
- Real-Time Calculations: Automatic updates provide immediate results as adjustments are made.
- Professional-Grade Template: A polished Excel file crafted for high-quality valuation purposes.
- Customizable and Reusable: Designed for adaptability, enabling repeated use for in-depth forecasts.
Key Features
- Real-Time CENX Data: Pre-loaded with Century Aluminum’s historical performance metrics and future projections.
- Comprehensive Input Customization: Modify growth rates, profit margins, discount rates, tax implications, and capital investments.
- Responsive Valuation Framework: Automatic recalculations of Net Present Value (NPV) and intrinsic value based on your adjustments.
- Scenario Analysis: Develop various forecasting scenarios to explore different valuation possibilities.
- Intuitive Interface: Clean, organized, and tailored for both seasoned professionals and newcomers.
How It Works
- 1. Access the Template: Download and open the Excel file featuring Century Aluminum Company’s (CENX) preloaded data.
- 2. Modify Assumptions: Adjust key parameters such as growth rates, WACC, and capital expenditures.
- 3. Instant Results: The DCF model automatically computes intrinsic value and NPV in real-time.
- 4. Explore Scenarios: Evaluate various forecasts to understand different valuation results.
- 5. Present with Assurance: Deliver professional valuation insights to back your strategic decisions.
Why Choose This Calculator for Century Aluminum Company (CENX)?
- Comprehensive Tool: Offers DCF, WACC, and financial ratio analyses tailored for Century Aluminum Company (CENX).
- Customizable Inputs: Modify yellow-highlighted cells to explore different financial scenarios for Century Aluminum Company (CENX).
- Detailed Insights: Automatically computes Century Aluminum Company’s (CENX) intrinsic value and Net Present Value.
- Preloaded Data: Historical and projected data provide reliable starting points for analysis of Century Aluminum Company (CENX).
- Professional Quality: Perfect for financial analysts, investors, and business consultants focusing on Century Aluminum Company (CENX).
Who Should Use This Product?
- Investors: Assess Century Aluminum's valuation before making stock transactions.
- CFOs and Financial Analysts: Optimize valuation methodologies and evaluate financial forecasts.
- Startup Founders: Understand the valuation processes of established companies like Century Aluminum.
- Consultants: Provide comprehensive valuation reports to clients in the aluminum industry.
- Students and Educators: Utilize real-time data to study and teach valuation strategies.
What the Template Contains
- Historical Data: Includes Century Aluminum Company’s past financials and baseline forecasts.
- DCF and Levered DCF Models: Detailed templates to calculate Century Aluminum Company’s intrinsic value.
- WACC Sheet: Pre-built calculations for Weighted Average Cost of Capital.
- Editable Inputs: Modify key drivers like growth rates, EBITDA %, and CAPEX assumptions.
- Quarterly and Annual Statements: A complete breakdown of Century Aluminum Company’s financials.
- Interactive Dashboard: Visualize valuation results and projections dynamically.
Disclaimer
All information, articles, and product details provided on this website are for general informational and educational purposes only. We do not claim any ownership over, nor do we intend to infringe upon, any trademarks, copyrights, logos, brand names, or other intellectual property mentioned or depicted on this site. Such intellectual property remains the property of its respective owners, and any references here are made solely for identification or informational purposes, without implying any affiliation, endorsement, or partnership.
We make no representations or warranties, express or implied, regarding the accuracy, completeness, or suitability of any content or products presented. Nothing on this website should be construed as legal, tax, investment, financial, medical, or other professional advice. In addition, no part of this site—including articles or product references—constitutes a solicitation, recommendation, endorsement, advertisement, or offer to buy or sell any securities, franchises, or other financial instruments, particularly in jurisdictions where such activity would be unlawful.
All content is of a general nature and may not address the specific circumstances of any individual or entity. It is not a substitute for professional advice or services. Any actions you take based on the information provided here are strictly at your own risk. You accept full responsibility for any decisions or outcomes arising from your use of this website and agree to release us from any liability in connection with your use of, or reliance upon, the content or products found herein.