
|
Clarkson plc (ckn.l) avaliação dcf |
Totalmente Editável: Adapte-Se Às Suas Necessidades No Excel Ou Planilhas
Design Profissional: Modelos Confiáveis E Padrão Da Indústria
Pré-Construídos Para Uso Rápido E Eficiente
Compatível com MAC/PC, totalmente desbloqueado
Não É Necessária Experiência; Fácil De Seguir
Clarkson PLC (CKN.L) Bundle
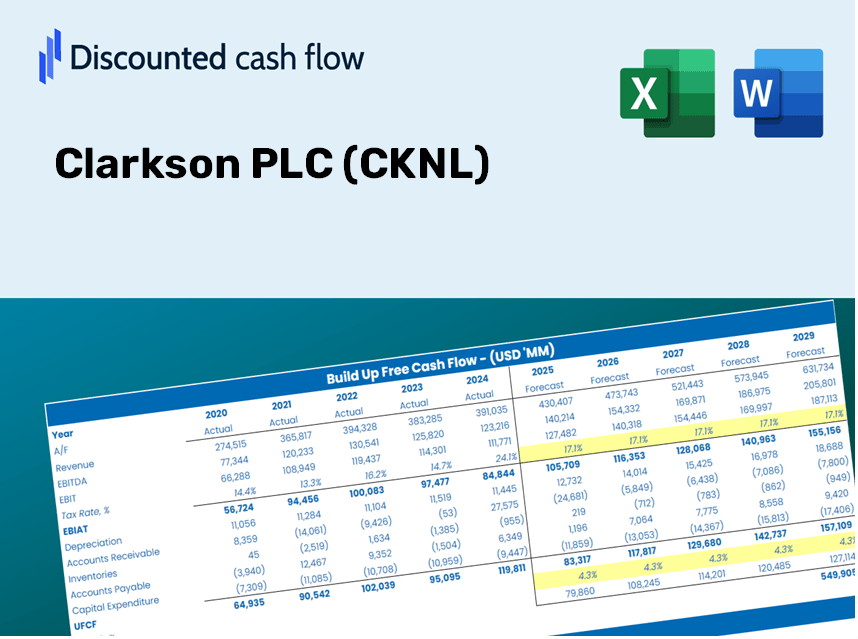
Procurando avaliar o valor intrínseco de Clarkson PLC? Nossa calculadora DCF (CKNL) integra dados do mundo real e oferece opções extensas de personalização, permitindo refinar suas previsões e aprimorar suas decisões de investimento.
Discounted Cash Flow (DCF) - (USD MM)
| Year | AY1 2020 |
AY2 2021 |
AY3 2022 |
AY4 2023 |
AY5 2024 |
FY1 2025 |
FY2 2026 |
FY3 2027 |
FY4 2028 |
FY5 2029 |
|---|---|---|---|---|---|---|---|---|---|---|
| Revenue | 358.2 | 443.3 | 603.8 | 639.4 | 661.4 | 776.0 | 910.4 | 1,068.2 | 1,253.2 | 1,470.3 |
| Revenue Growth, % | 0 | 23.76 | 36.21 | 5.9 | 3.44 | 17.33 | 17.33 | 17.33 | 17.33 | 17.33 |
| EBITDA | 1.2 | 86.2 | 120.1 | 108.6 | 134.2 | 119.4 | 140.1 | 164.4 | 192.9 | 226.3 |
| EBITDA, % | 0.33501 | 19.45 | 19.89 | 16.98 | 20.29 | 15.39 | 15.39 | 15.39 | 15.39 | 15.39 |
| Depreciation | 14.5 | 14.9 | 17.8 | 8.2 | 20.2 | 22.8 | 26.8 | 31.4 | 36.8 | 43.2 |
| Depreciation, % | 4.05 | 3.36 | 2.95 | 1.28 | 3.05 | 2.94 | 2.94 | 2.94 | 2.94 | 2.94 |
| EBIT | -13.3 | 71.3 | 102.3 | 100.4 | 114.0 | 96.6 | 113.4 | 133.0 | 156.0 | 183.1 |
| EBIT, % | -3.71 | 16.08 | 16.94 | 15.7 | 17.24 | 12.45 | 12.45 | 12.45 | 12.45 | 12.45 |
| Total Cash | 204.5 | 271.9 | 387.9 | 439.0 | 493.5 | 505.9 | 593.5 | 696.3 | 817.0 | 958.5 |
| Total Cash, percent | .0 | .0 | .0 | .0 | .0 | .0 | .0 | .0 | .0 | .0 |
| Account Receivables | 61.5 | 112.9 | 141.0 | 125.8 | 120.4 | 161.2 | 189.1 | 221.9 | 260.3 | 305.4 |
| Account Receivables, % | 17.17 | 25.47 | 23.35 | 19.67 | 18.2 | 20.77 | 20.77 | 20.77 | 20.77 | 20.77 |
| Inventories | 1.3 | 1.5 | 2.4 | 3.3 | 4.3 | 3.5 | 4.1 | 4.8 | 5.7 | 6.7 |
| Inventories, % | 0.36293 | 0.33837 | 0.39748 | 0.51611 | 0.65014 | 0.453 | 0.453 | 0.453 | 0.453 | 0.453 |
| Accounts Payable | 17.0 | 39.4 | 50.0 | 34.4 | 18.8 | 46.8 | 54.9 | 64.4 | 75.5 | 88.6 |
| Accounts Payable, % | 4.75 | 8.89 | 8.28 | 5.38 | 2.84 | 6.03 | 6.03 | 6.03 | 6.03 | 6.03 |
| Capital Expenditure | -9.8 | -6.6 | -9.6 | -8.0 | -5.7 | -12.3 | -14.4 | -16.9 | -19.9 | -23.3 |
| Capital Expenditure, % | -2.74 | -1.49 | -1.59 | -1.25 | -0.86181 | -1.59 | -1.59 | -1.59 | -1.59 | -1.59 |
| Tax Rate, % | 24.26 | 24.26 | 24.26 | 24.26 | 24.26 | 24.26 | 24.26 | 24.26 | 24.26 | 24.26 |
| EBITAT | -23.4 | 51.7 | 77.3 | 77.3 | 86.3 | 77.4 | 90.9 | 106.6 | 125.1 | 146.7 |
| Depreciation | ||||||||||
| Changes in Account Receivables | ||||||||||
| Changes in Inventories | ||||||||||
| Changes in Accounts Payable | ||||||||||
| Capital Expenditure | ||||||||||
| UFCF | -64.5 | 30.8 | 67.1 | 76.2 | 89.6 | 75.9 | 82.7 | 97.1 | 113.9 | 133.6 |
| WACC, % | 8.66 | 8.63 | 8.63 | 8.63 | 8.63 | 8.64 | 8.64 | 8.64 | 8.64 | 8.64 |
| PV UFCF | ||||||||||
| SUM PV UFCF | 385.8 | |||||||||
| Long Term Growth Rate, % | 1.00 | |||||||||
| Free cash flow (T + 1) | 135 | |||||||||
| Terminal Value | 1,767 | |||||||||
| Present Terminal Value | 1,168 | |||||||||
| Enterprise Value | 1,553 | |||||||||
| Net Debt | -393 | |||||||||
| Equity Value | 1,947 | |||||||||
| Diluted Shares Outstanding, MM | 31 | |||||||||
| Equity Value Per Share | 6,299.73 |
What You Will Receive
- Authentic CKNL Financial Data: Pre-populated with Clarkson PLC’s historical and projected figures for accurate analysis.
- Completely Customizable Template: Easily adjust essential inputs like revenue growth, WACC, and EBITDA percentage.
- Instant Calculations: Witness Clarkson PLC's intrinsic value refresh immediately as you make changes.
- Expert Valuation Tool: Tailored for investors, analysts, and consultants seeking precise DCF outcomes.
- Intuitive Design: Clear layout and straightforward instructions suitable for all skill levels.
Key Features
- Comprehensive CKNL Data: Pre-loaded with Clarkson PLC's historical financial performance and future growth projections.
- Customizable Input Options: Modify variables such as revenue growth rates, margins, WACC, tax rates, and capital expenditures.
- Adaptive Valuation Model: Real-time updates to Net Present Value (NPV) and intrinsic value based on your customized inputs.
- Scenario Analysis: Develop multiple forecasting scenarios to explore varied valuation results.
- User-Centric Interface: Intuitive, organized, and tailored for both professionals and newcomers.
How It Works
- Download the Template: Gain immediate access to the Excel-based CKNL DCF Calculator.
- Input Your Assumptions: Modify the yellow-highlighted cells for growth rates, WACC, margins, and other parameters.
- Instant Calculations: The model automatically refreshes Clarkson PLC’s intrinsic value based on your inputs.
- Test Scenarios: Experiment with various assumptions to see how valuation changes could play out.
- Analyze and Decide: Leverage the results to inform your investment strategy or financial assessments.
Why Opt for the Clarkson PLC (CKNL) Calculator?
- Designed for Experts: A sophisticated tool utilized by analysts, CFOs, and financial consultants.
- Accurate Financial Data: Historical and projected financial information for Clarkson PLC preloaded for precision.
- Flexible Scenario Analysis: Effortlessly simulate various forecasts and assumptions.
- Comprehensive Results: Automatically calculates intrinsic value, NPV, and essential financial metrics.
- User-Friendly: Step-by-step guidance to navigate through the calculator effortlessly.
Who Would Benefit from This Product?
- Investors: Effectively assess Clarkson PLC's (CKNL) fair value prior to making investment choices.
- CFOs: Utilize a high-quality DCF model for financial analysis and reporting.
- Consultants: Easily modify the template for client valuation reports.
- Entrepreneurs: Discover financial modeling techniques utilized by industry leaders.
- Educators: Employ it as an educational resource to illustrate various valuation methods.
Contents of the Template
- Historical Data: A comprehensive overview of Clarkson PLC’s (CKNL) previous financial performance and foundational forecasts.
- DCF and Levered DCF Models: In-depth templates designed to assess the intrinsic value of Clarkson PLC (CKNL).
- WACC Sheet: Pre-configured calculations for the Weighted Average Cost of Capital.
- Editable Inputs: Customize essential drivers such as growth rates, EBITDA margins, and CAPEX assumptions.
- Quarterly and Annual Statements: An extensive analysis of Clarkson PLC’s (CKNL) financial data.
- Interactive Dashboard: Dynamically visualize valuation results and forecasts.
Disclaimer
All information, articles, and product details provided on this website are for general informational and educational purposes only. We do not claim any ownership over, nor do we intend to infringe upon, any trademarks, copyrights, logos, brand names, or other intellectual property mentioned or depicted on this site. Such intellectual property remains the property of its respective owners, and any references here are made solely for identification or informational purposes, without implying any affiliation, endorsement, or partnership.
We make no representations or warranties, express or implied, regarding the accuracy, completeness, or suitability of any content or products presented. Nothing on this website should be construed as legal, tax, investment, financial, medical, or other professional advice. In addition, no part of this site—including articles or product references—constitutes a solicitation, recommendation, endorsement, advertisement, or offer to buy or sell any securities, franchises, or other financial instruments, particularly in jurisdictions where such activity would be unlawful.
All content is of a general nature and may not address the specific circumstances of any individual or entity. It is not a substitute for professional advice or services. Any actions you take based on the information provided here are strictly at your own risk. You accept full responsibility for any decisions or outcomes arising from your use of this website and agree to release us from any liability in connection with your use of, or reliance upon, the content or products found herein.