
|
Clean Energy Fuels Corp. (CLNE) Avaliação DCF |
Totalmente Editável: Adapte-Se Às Suas Necessidades No Excel Ou Planilhas
Design Profissional: Modelos Confiáveis E Padrão Da Indústria
Pré-Construídos Para Uso Rápido E Eficiente
Compatível com MAC/PC, totalmente desbloqueado
Não É Necessária Experiência; Fácil De Seguir
Clean Energy Fuels Corp. (CLNE) Bundle
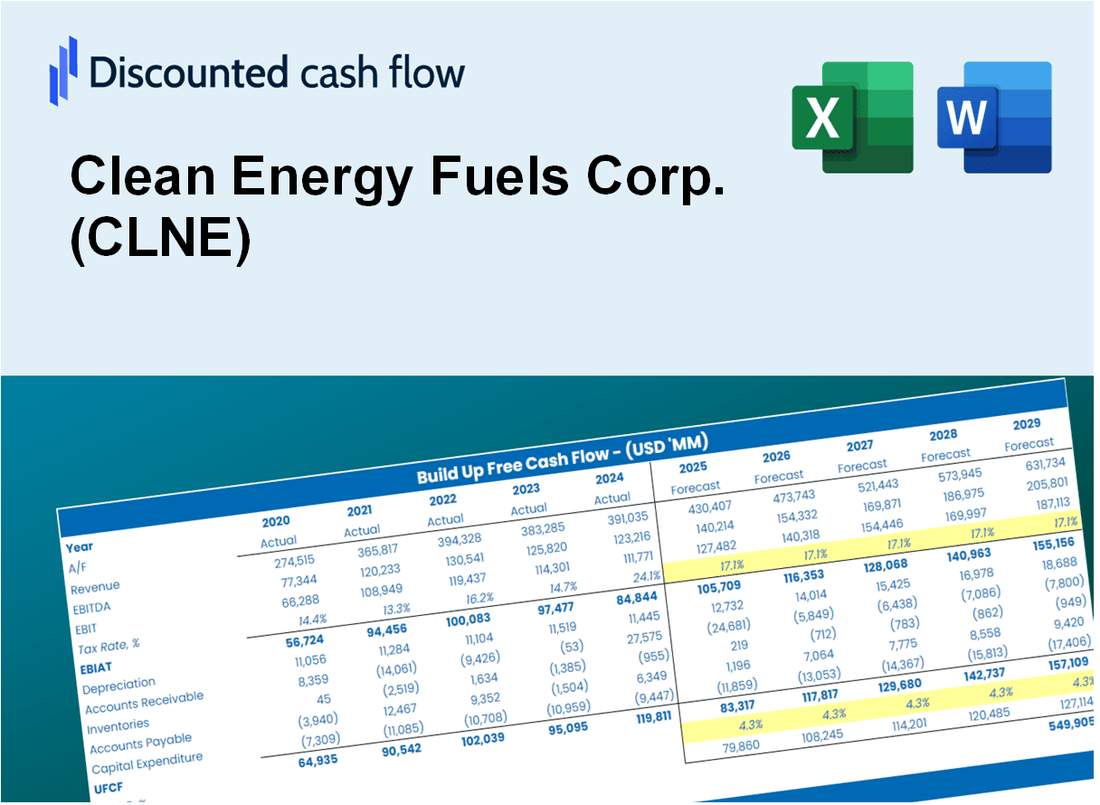
Aprimore suas estratégias de investimento com a calculadora DCF da Clean Energy Fuels Corp. (CLNE)! Utilize dados financeiros precisos, ajuste as projeções e custos de crescimento e observe instantaneamente como essas modificações afetam o valor intrínseco da Clean Energy Fuels Corp. (CLNE).
Discounted Cash Flow (DCF) - (USD MM)
| Year | AY1 2020 |
AY2 2021 |
AY3 2022 |
AY4 2023 |
AY5 2024 |
FY1 2025 |
FY2 2026 |
FY3 2027 |
FY4 2028 |
FY5 2029 |
|---|---|---|---|---|---|---|---|---|---|---|
| Revenue | 291.7 | 255.6 | 420.2 | 425.2 | 415.9 | 468.9 | 528.6 | 596.0 | 672.0 | 757.7 |
| Revenue Growth, % | 0 | -12.37 | 64.35 | 1.19 | -2.19 | 12.75 | 12.75 | 12.75 | 12.75 | 12.75 |
| EBITDA | 43.8 | -44.4 | 1.6 | -31.9 | -4.1 | -9.8 | -11.1 | -12.5 | -14.1 | -15.9 |
| EBITDA, % | 15.02 | -17.38 | 0.38366 | -7.51 | -0.98133 | -2.09 | -2.09 | -2.09 | -2.09 | -2.09 |
| Depreciation | 47.7 | 45.2 | 54.7 | 45.7 | 44.7 | 64.3 | 72.5 | 81.7 | 92.1 | 103.9 |
| Depreciation, % | 16.34 | 17.67 | 13.01 | 10.74 | 10.76 | 13.71 | 13.71 | 13.71 | 13.71 | 13.71 |
| EBIT | -3.9 | -89.6 | -53.1 | -77.6 | -48.8 | -74.1 | -83.5 | -94.2 | -106.2 | -119.7 |
| EBIT, % | -1.33 | -35.05 | -12.63 | -18.25 | -11.74 | -15.8 | -15.8 | -15.8 | -15.8 | -15.8 |
| Total Cash | 138.5 | 229.2 | 265.5 | 263.1 | 217.5 | 294.9 | 332.5 | 374.9 | 422.7 | 476.6 |
| Total Cash, percent | .0 | .0 | .0 | .0 | .0 | .0 | .0 | .0 | .0 | .0 |
| Account Receivables | 85.4 | 111.9 | 108.5 | 118.2 | 127.7 | 147.6 | 166.4 | 187.6 | 211.5 | 238.5 |
| Account Receivables, % | 29.29 | 43.76 | 25.81 | 27.8 | 30.7 | 31.47 | 31.47 | 31.47 | 31.47 | 31.47 |
| Inventories | 28.1 | 31.3 | 37.1 | 45.3 | 43.4 | 48.6 | 54.8 | 61.8 | 69.7 | 78.5 |
| Inventories, % | 9.63 | 12.24 | 8.84 | 10.66 | 10.44 | 10.36 | 10.36 | 10.36 | 10.36 | 10.36 |
| Accounts Payable | 17.3 | 24.4 | 44.4 | 57.0 | 33.3 | 44.5 | 50.2 | 56.6 | 63.8 | 71.9 |
| Accounts Payable, % | 5.93 | 9.53 | 10.58 | 13.41 | 8.01 | 9.49 | 9.49 | 9.49 | 9.49 | 9.49 |
| Capital Expenditure | -13.3 | -28.9 | -53.5 | -121.3 | -65.0 | -68.2 | -76.9 | -86.7 | -97.8 | -110.2 |
| Capital Expenditure, % | -4.55 | -11.31 | -12.73 | -28.53 | -15.63 | -14.55 | -14.55 | -14.55 | -14.55 | -14.55 |
| Tax Rate, % | -2.56 | -2.56 | -2.56 | -2.56 | -2.56 | -2.56 | -2.56 | -2.56 | -2.56 | -2.56 |
| EBITAT | -3.4 | -88.8 | -52.5 | -76.8 | -50.1 | -71.8 | -81.0 | -91.3 | -103.0 | -116.1 |
| Depreciation | ||||||||||
| Changes in Account Receivables | ||||||||||
| Changes in Inventories | ||||||||||
| Changes in Accounts Payable | ||||||||||
| Capital Expenditure | ||||||||||
| UFCF | -65.2 | -95.1 | -33.7 | -157.8 | -101.6 | -89.7 | -104.8 | -118.1 | -133.2 | -150.2 |
| WACC, % | 11.6 | 12.02 | 12.01 | 12.02 | 12.05 | 11.94 | 11.94 | 11.94 | 11.94 | 11.94 |
| PV UFCF | ||||||||||
| SUM PV UFCF | -418.2 | |||||||||
| Long Term Growth Rate, % | 2.00 | |||||||||
| Free cash flow (T + 1) | -153 | |||||||||
| Terminal Value | -1,541 | |||||||||
| Present Terminal Value | -877 | |||||||||
| Enterprise Value | -1,295 | |||||||||
| Net Debt | 276 | |||||||||
| Equity Value | -1,571 | |||||||||
| Diluted Shares Outstanding, MM | 223 | |||||||||
| Equity Value Per Share | -7.03 |
What You Will Get
- Real Clean Energy Data: Preloaded financials – from revenue to EBIT – based on actual and projected figures for Clean Energy Fuels Corp. (CLNE).
- Full Customization: Adjust all critical parameters (yellow cells) like WACC, growth %, and tax rates to fit your analysis.
- Instant Valuation Updates: Automatic recalculations to assess the impact of changes on Clean Energy Fuels Corp.'s (CLNE) fair value.
- Versatile Excel Template: Designed for quick edits, scenario testing, and comprehensive projections.
- Time-Saving and Accurate: Avoid starting from scratch while ensuring precision and adaptability.
Key Features
- Accurate Clean Energy Financials: Access reliable pre-loaded historical data and future projections for Clean Energy Fuels Corp. (CLNE).
- Customizable Forecast Assumptions: Modify highlighted cells for key metrics such as WACC, growth rates, and profit margins.
- Dynamic Calculations: Automatic updates to DCF, Net Present Value (NPV), and cash flow analysis tailored for the clean energy sector.
- Visual Dashboard: User-friendly charts and summaries to help visualize your valuation results for Clean Energy Fuels Corp. (CLNE).
- Designed for All Users: An intuitive structure suitable for investors, CFOs, and consultants, whether experienced or new to the field.
How It Works
- 1. Access the Template: Download and open the Excel file containing Clean Energy Fuels Corp.'s (CLNE) preloaded data.
- 2. Adjust Assumptions: Modify key inputs such as growth rates, WACC, and capital expenditures to reflect your expectations.
- 3. View Results Instantly: The DCF model automatically calculates the intrinsic value and NPV based on your inputs.
- 4. Explore Scenarios: Analyze various forecasts to evaluate different valuation outcomes for Clean Energy Fuels Corp. (CLNE).
- 5. Present with Confidence: Share professional valuation insights to enhance your decision-making process.
Why Choose This Calculator for Clean Energy Fuels Corp. (CLNE)?
- Accuracy: Reliable financial data from Clean Energy Fuels Corp. ensures precision.
- Flexibility: Tailored for users to easily adjust and experiment with various inputs.
- Time-Saving: Eliminate the complexities of constructing a DCF model from the ground up.
- Professional-Grade: Crafted with the expertise and usability expected at the CFO level.
- User-Friendly: Intuitive interface, suitable for users with varying levels of financial modeling skills.
Who Should Use This Product?
- Individual Investors: Gain insights to make informed decisions about buying or selling Clean Energy Fuels Corp. (CLNE) stock.
- Financial Analysts: Enhance valuation processes with comprehensive financial models tailored for Clean Energy Fuels Corp. (CLNE).
- Consultants: Provide clients with accurate and timely valuation insights related to Clean Energy Fuels Corp. (CLNE).
- Business Owners: Learn how companies like Clean Energy Fuels Corp. (CLNE) are valued to inform your own business strategies.
- Finance Students: Explore valuation techniques using real-world data and scenarios from Clean Energy Fuels Corp. (CLNE).
What the Template Contains
- Operating and Balance Sheet Data: Pre-filled Clean Energy Fuels Corp. (CLNE) historical data and forecasts, including revenue, EBITDA, EBIT, and capital expenditures.
- WACC Calculation: A dedicated sheet for Weighted Average Cost of Capital (WACC), featuring parameters such as Beta, risk-free rate, and share price.
- DCF Valuation (Unlevered and Levered): Editable Discounted Cash Flow models illustrating intrinsic value with comprehensive calculations.
- Financial Statements: Pre-loaded financial statements (annual and quarterly) to facilitate analysis.
- Key Ratios: Includes profitability, leverage, and efficiency ratios for Clean Energy Fuels Corp. (CLNE).
- Dashboard and Charts: Visual summary of valuation outputs and assumptions to simplify results analysis.
Disclaimer
All information, articles, and product details provided on this website are for general informational and educational purposes only. We do not claim any ownership over, nor do we intend to infringe upon, any trademarks, copyrights, logos, brand names, or other intellectual property mentioned or depicted on this site. Such intellectual property remains the property of its respective owners, and any references here are made solely for identification or informational purposes, without implying any affiliation, endorsement, or partnership.
We make no representations or warranties, express or implied, regarding the accuracy, completeness, or suitability of any content or products presented. Nothing on this website should be construed as legal, tax, investment, financial, medical, or other professional advice. In addition, no part of this site—including articles or product references—constitutes a solicitation, recommendation, endorsement, advertisement, or offer to buy or sell any securities, franchises, or other financial instruments, particularly in jurisdictions where such activity would be unlawful.
All content is of a general nature and may not address the specific circumstances of any individual or entity. It is not a substitute for professional advice or services. Any actions you take based on the information provided here are strictly at your own risk. You accept full responsibility for any decisions or outcomes arising from your use of this website and agree to release us from any liability in connection with your use of, or reliance upon, the content or products found herein.