
|
Avaliação DCF de Clipper Realty Inc. (CLPR) |
Totalmente Editável: Adapte-Se Às Suas Necessidades No Excel Ou Planilhas
Design Profissional: Modelos Confiáveis E Padrão Da Indústria
Pré-Construídos Para Uso Rápido E Eficiente
Compatível com MAC/PC, totalmente desbloqueado
Não É Necessária Experiência; Fácil De Seguir
Clipper Realty Inc. (CLPR) Bundle
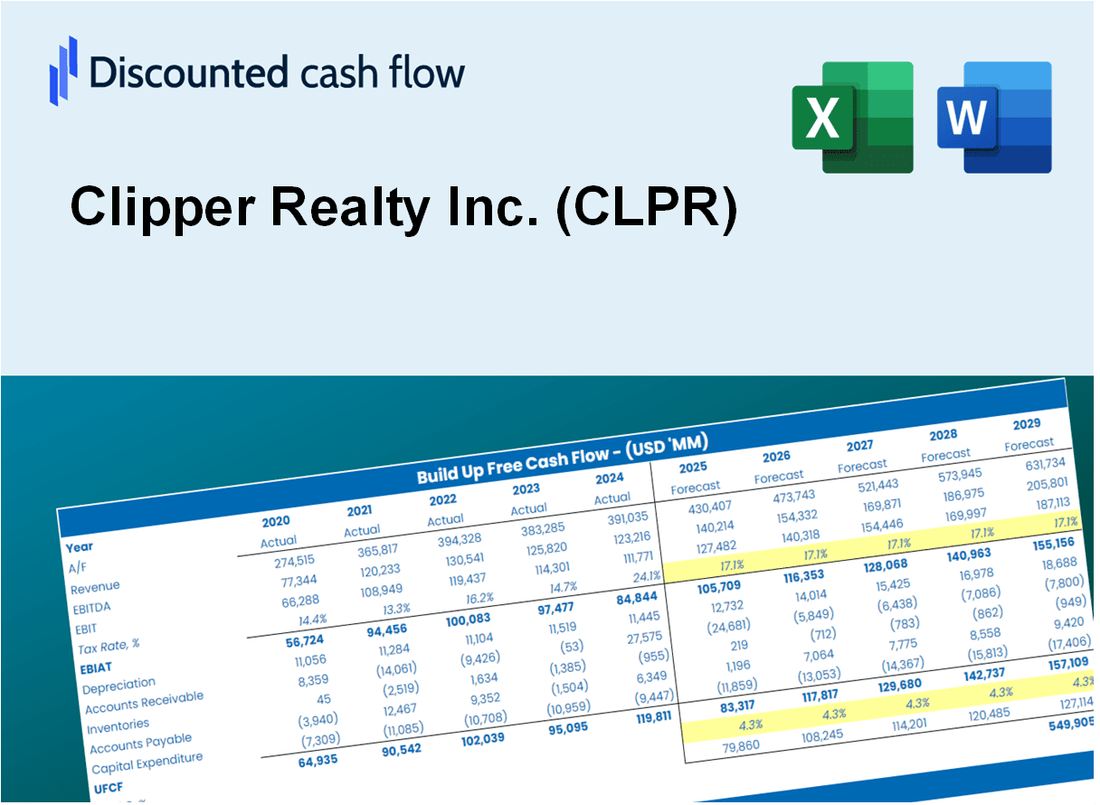
Explore a perspectiva financeira do Explore Clipper Realty Inc. (CLPR) com a nossa calculadora DCF! Digite suas projeções de crescimento, margens e despesas para determinar o valor intrínseco da Clipper Realty Inc. (CLPR) e moldar sua abordagem de investimento.
Discounted Cash Flow (DCF) - (USD MM)
| Year | AY1 2020 |
AY2 2021 |
AY3 2022 |
AY4 2023 |
AY5 2024 |
FY1 2025 |
FY2 2026 |
FY3 2027 |
FY4 2028 |
FY5 2029 |
|---|---|---|---|---|---|---|---|---|---|---|
| Revenue | 122.9 | 122.7 | 129.7 | 138.2 | 148.8 | 156.1 | 163.9 | 172.0 | 180.5 | 189.4 |
| Revenue Growth, % | 0 | -0.0984941 | 5.72 | 6.52 | 7.65 | 4.95 | 4.95 | 4.95 | 4.95 | 4.95 |
| EBITDA | 54.5 | 52.7 | 55.4 | 58.2 | 70.4 | 68.5 | 71.9 | 75.5 | 79.2 | 83.1 |
| EBITDA, % | 44.4 | 42.95 | 42.67 | 42.14 | 47.33 | 43.9 | 43.9 | 43.9 | 43.9 | 43.9 |
| Depreciation | 23.2 | 25.8 | 27.5 | 28.8 | 29.8 | 31.8 | 33.4 | 35.1 | 36.8 | 38.6 |
| Depreciation, % | 18.92 | 20.99 | 21.17 | 20.84 | 20.02 | 20.39 | 20.39 | 20.39 | 20.39 | 20.39 |
| EBIT | 31.3 | 27.0 | 27.9 | 29.4 | 40.6 | 36.7 | 38.5 | 40.4 | 42.4 | 44.5 |
| EBIT, % | 25.48 | 21.96 | 21.5 | 21.3 | 27.31 | 23.51 | 23.51 | 23.51 | 23.51 | 23.51 |
| Total Cash | 72.1 | 34.5 | 18.2 | 22.2 | 19.9 | 40.7 | 42.7 | 44.8 | 47.0 | 49.3 |
| Total Cash, percent | .0 | .0 | .0 | .0 | .0 | .0 | .0 | .0 | .0 | .0 |
| Account Receivables | 7.0 | 10.3 | 5.0 | 5.2 | 6.4 | 8.1 | 8.5 | 8.9 | 9.4 | 9.8 |
| Account Receivables, % | 5.7 | 8.36 | 3.86 | 3.75 | 4.28 | 5.19 | 5.19 | 5.19 | 5.19 | 5.19 |
| Inventories | 17.0 | 17.7 | 12.5 | .0 | .0 | 11.8 | 12.4 | 13.0 | 13.7 | 14.4 |
| Inventories, % | 13.82 | 14.42 | 9.64 | 0 | 0 | 7.58 | 7.58 | 7.58 | 7.58 | 7.58 |
| Accounts Payable | 11.7 | 19.6 | 17.1 | 21.0 | 18.7 | 20.7 | 21.8 | 22.8 | 24.0 | 25.2 |
| Accounts Payable, % | 9.54 | 15.94 | 13.17 | 15.19 | 12.59 | 13.29 | 13.29 | 13.29 | 13.29 | 13.29 |
| Capital Expenditure | -31.8 | -35.5 | -45.5 | -41.4 | .0 | -37.4 | -39.3 | -41.2 | -43.2 | -45.4 |
| Capital Expenditure, % | -25.89 | -28.95 | -35.03 | -29.92 | 0 | -23.96 | -23.96 | -23.96 | -23.96 | -23.96 |
| Tax Rate, % | 62.02 | 62.02 | 62.02 | 62.02 | 62.02 | 62.02 | 62.02 | 62.02 | 62.02 | 62.02 |
| EBITAT | 12.6 | 11.1 | 12.7 | 11.2 | 15.4 | 14.9 | 15.6 | 16.4 | 17.2 | 18.1 |
| Depreciation | ||||||||||
| Changes in Account Receivables | ||||||||||
| Changes in Inventories | ||||||||||
| Changes in Accounts Payable | ||||||||||
| Capital Expenditure | ||||||||||
| UFCF | -8.3 | 5.2 | 2.7 | 14.8 | 41.8 | -2.2 | 9.8 | 10.3 | 10.8 | 11.3 |
| WACC, % | 1.8 | 1.84 | 2 | 1.73 | 1.73 | 1.82 | 1.82 | 1.82 | 1.82 | 1.82 |
| PV UFCF | ||||||||||
| SUM PV UFCF | 37.4 | |||||||||
| Long Term Growth Rate, % | 2.00 | |||||||||
| Free cash flow (T + 1) | 12 | |||||||||
| Terminal Value | -6,430 | |||||||||
| Present Terminal Value | -5,876 | |||||||||
| Enterprise Value | -5,838 | |||||||||
| Net Debt | 1,246 | |||||||||
| Equity Value | -7,085 | |||||||||
| Diluted Shares Outstanding, MM | 16 | |||||||||
| Equity Value Per Share | -439.72 |
What You Will Get
- Real Clipper Realty Data: Preloaded financials – from revenue to EBIT – based on actual and projected figures for Clipper Realty Inc. (CLPR).
- Full Customization: Adjust all critical parameters (yellow cells) like WACC, growth %, and tax rates specific to Clipper Realty Inc. (CLPR).
- Instant Valuation Updates: Automatic recalculations to analyze the impact of changes on Clipper Realty Inc.'s (CLPR) fair value.
- Versatile Excel Template: Tailored for quick edits, scenario testing, and detailed projections for Clipper Realty Inc. (CLPR).
- Time-Saving and Accurate: Skip building models from scratch while maintaining precision and flexibility for Clipper Realty Inc. (CLPR).
Key Features
- Comprehensive Clipper Realty Data: Gain access to reliable historical performance and future outlooks.
- Adjustable Forecast Parameters: Modify highlighted cells for metrics like cap rates, occupancy rates, and revenue growth.
- Real-Time Calculations: Instant updates to DCF, Net Present Value (NPV), and revenue analysis.
- User-Friendly Dashboard: Clear charts and summaries to help you interpret your valuation findings.
- Suitable for All Skill Levels: An intuitive design tailored for investors, analysts, and real estate professionals.
How It Works
- Download the Template: Gain immediate access to the Excel-based CLPR DCF Calculator.
- Input Your Assumptions: Modify the yellow-highlighted cells for growth rates, WACC, margins, and other factors.
- Instant Calculations: The model automatically recalculates Clipper Realty Inc.'s intrinsic value.
- Test Scenarios: Experiment with various assumptions to assess potential valuation shifts.
- Analyze and Decide: Utilize the outcomes to inform your investment or financial analysis.
Why Choose Clipper Realty Inc. (CLPR) Calculator?
- User-Friendly Interface: Ideal for both novice and seasoned investors.
- Customizable Inputs: Adjust parameters easily to suit your financial analysis.
- Real-Time Valuation: Observe immediate updates to Clipper Realty’s valuation as you modify inputs.
- Preloaded Data: Comes with Clipper Realty’s actual financial metrics for swift evaluations.
- Endorsed by Experts: Favored by analysts and investors for making strategic choices.
Who Should Use Clipper Realty Inc. (CLPR)?
- Real Estate Students: Explore property valuation methods and apply them to real market data.
- Researchers: Integrate advanced models into academic studies or real estate research.
- Investors: Validate your investment strategies and evaluate valuation metrics for Clipper Realty Inc. (CLPR).
- Financial Analysts: Enhance your analysis with a ready-to-use, customizable DCF model tailored for real estate.
- Property Managers: Understand how publicly traded real estate companies like Clipper Realty Inc. (CLPR) are assessed.
What the Template Contains
- Pre-Filled Data: Contains Clipper Realty Inc.'s historical financials and future projections.
- Discounted Cash Flow Model: Interactive DCF valuation model with real-time calculations.
- Weighted Average Cost of Capital (WACC): A specific sheet for calculating WACC using personalized inputs.
- Key Financial Ratios: Evaluate Clipper Realty Inc.'s profitability, efficiency, and financial leverage.
- Customizable Inputs: Easily modify revenue growth, profit margins, and tax rates.
- Clear Dashboard: Visual representations and tables summarizing essential valuation outcomes.
Disclaimer
All information, articles, and product details provided on this website are for general informational and educational purposes only. We do not claim any ownership over, nor do we intend to infringe upon, any trademarks, copyrights, logos, brand names, or other intellectual property mentioned or depicted on this site. Such intellectual property remains the property of its respective owners, and any references here are made solely for identification or informational purposes, without implying any affiliation, endorsement, or partnership.
We make no representations or warranties, express or implied, regarding the accuracy, completeness, or suitability of any content or products presented. Nothing on this website should be construed as legal, tax, investment, financial, medical, or other professional advice. In addition, no part of this site—including articles or product references—constitutes a solicitation, recommendation, endorsement, advertisement, or offer to buy or sell any securities, franchises, or other financial instruments, particularly in jurisdictions where such activity would be unlawful.
All content is of a general nature and may not address the specific circumstances of any individual or entity. It is not a substitute for professional advice or services. Any actions you take based on the information provided here are strictly at your own risk. You accept full responsibility for any decisions or outcomes arising from your use of this website and agree to release us from any liability in connection with your use of, or reliance upon, the content or products found herein.