
|
Chemomab Therapeutics Ltd. (CMMB) Avaliação DCF |
Totalmente Editável: Adapte-Se Às Suas Necessidades No Excel Ou Planilhas
Design Profissional: Modelos Confiáveis E Padrão Da Indústria
Pré-Construídos Para Uso Rápido E Eficiente
Compatível com MAC/PC, totalmente desbloqueado
Não É Necessária Experiência; Fácil De Seguir
Chemomab Therapeutics Ltd. (CMMB) Bundle
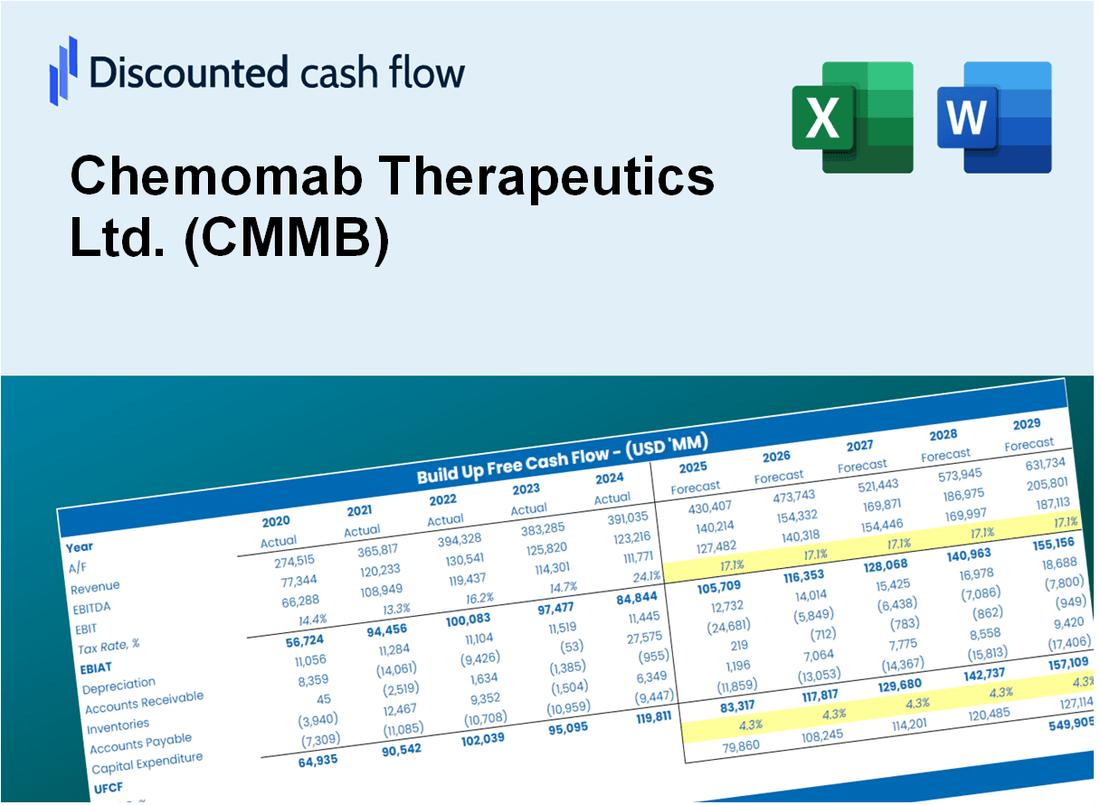
Obtenha informações sobre sua análise de avaliação da Chemomab Therapeutics Ltd. (CMMB) usando nossa calculadora DCF de última geração! Este modelo do Excel é pré -carregado com dados reais (CMMB), permitindo ajustar as previsões e suposições para um cálculo preciso do valor intrínseco da Chemomab Therapeutics Ltd.
Discounted Cash Flow (DCF) - (USD MM)
| Year | AY1 2020 |
AY2 2021 |
AY3 2022 |
AY4 2023 |
AY5 2024 |
FY1 2025 |
FY2 2026 |
FY3 2027 |
FY4 2028 |
FY5 2029 |
|---|---|---|---|---|---|---|---|---|---|---|
| Revenue | .0 | .0 | .0 | .0 | .0 | .0 | .0 | .0 | .0 | .0 |
| Revenue Growth, % | 0 | 0 | 0 | 0 | 0 | 0 | 0 | 0 | 0 | 0 |
| EBITDA | -5.9 | -12.3 | -28.5 | -25.4 | -14.0 | .0 | .0 | .0 | .0 | .0 |
| EBITDA, % | 100 | 100 | 100 | 100 | 100 | 100 | 100 | 100 | 100 | 100 |
| Depreciation | .0 | .0 | .1 | .1 | .1 | .0 | .0 | .0 | .0 | .0 |
| Depreciation, % | 100 | 100 | 100 | 100 | 100 | 100 | 100 | 100 | 100 | 100 |
| EBIT | -6.0 | -12.4 | -28.5 | -25.5 | -14.0 | .0 | .0 | .0 | .0 | .0 |
| EBIT, % | 100 | 100 | 100 | 100 | 100 | 100 | 100 | 100 | 100 | 100 |
| Total Cash | 11.7 | 61.2 | 39.9 | 19.8 | 14.3 | .0 | .0 | .0 | .0 | .0 |
| Total Cash, percent | .0 | .0 | .0 | .0 | .0 | .0 | .0 | .0 | .0 | .0 |
| Account Receivables | .1 | .2 | .5 | .3 | .3 | .0 | .0 | .0 | .0 | .0 |
| Account Receivables, % | 100 | 100 | 100 | 100 | 100 | 100 | 100 | 100 | 100 | 100 |
| Inventories | .0 | -1.3 | .0 | .0 | .0 | .0 | .0 | .0 | .0 | .0 |
| Inventories, % | 100 | 100 | 100 | 100 | 100 | 100 | 100 | 100 | 100 | 100 |
| Accounts Payable | .1 | 1.3 | 1.7 | .5 | .7 | .0 | .0 | .0 | .0 | .0 |
| Accounts Payable, % | 100 | 100 | 100 | 100 | 100 | 100 | 100 | 100 | 100 | 100 |
| Capital Expenditure | .0 | -.2 | -.1 | .0 | .0 | .0 | .0 | .0 | .0 | .0 |
| Capital Expenditure, % | 100 | 100 | 100 | 100 | 100 | 0 | 0 | 0 | 0 | 0 |
| Tax Rate, % | 0 | 0 | 0 | 0 | 0 | 0 | 0 | 0 | 0 | 0 |
| EBITAT | -6.0 | -12.4 | -28.0 | -25.5 | -14.0 | .0 | .0 | .0 | .0 | .0 |
| Depreciation | ||||||||||
| Changes in Account Receivables | ||||||||||
| Changes in Inventories | ||||||||||
| Changes in Accounts Payable | ||||||||||
| Capital Expenditure | ||||||||||
| UFCF | -6.0 | -10.1 | -29.3 | -26.4 | -13.8 | -.4 | .0 | .0 | .0 | .0 |
| WACC, % | 6.01 | 6.01 | 6 | 6.01 | 6.01 | 6 | 6 | 6 | 6 | 6 |
| PV UFCF | ||||||||||
| SUM PV UFCF | -.4 | |||||||||
| Long Term Growth Rate, % | 2.00 | |||||||||
| Free cash flow (T + 1) | 0 | |||||||||
| Terminal Value | 0 | |||||||||
| Present Terminal Value | 0 | |||||||||
| Enterprise Value | 0 | |||||||||
| Net Debt | -6 | |||||||||
| Equity Value | 5 | |||||||||
| Diluted Shares Outstanding, MM | 1 | |||||||||
| Equity Value Per Share | 5.98 |
What You Will Receive
- Customizable Excel Template: A fully adaptable Excel-based DCF Calculator featuring pre-filled real CMMB financials.
- Real-World Data: Historical data and future estimates (highlighted in the yellow cells).
- Forecast Flexibility: Adjust forecast assumptions such as revenue growth, EBITDA %, and WACC.
- Instant Calculations: See the immediate effect of your inputs on Chemomab’s valuation.
- Professional Resource: Designed for investors, CFOs, consultants, and financial analysts.
- User-Friendly Interface: Organized for clarity and convenience, complete with step-by-step guidance.
Key Features
- 🔍 Real-Life CMMB Financials: Pre-filled historical and projected data for Chemomab Therapeutics Ltd.
- ✏️ Fully Customizable Inputs: Adjust all critical parameters (yellow cells) like WACC, growth %, and tax rates.
- 📊 Professional DCF Valuation: Built-in formulas calculate Chemomab’s intrinsic value using the Discounted Cash Flow method.
- ⚡ Instant Results: Visualize Chemomab’s valuation instantly after making changes.
- Scenario Analysis: Test and compare outcomes for various financial assumptions side-by-side.
How It Works
- Step 1: Download the prebuilt Excel template featuring Chemomab Therapeutics Ltd. (CMMB) data.
- Step 2: Review the pre-filled sheets to familiarize yourself with the essential metrics.
- Step 3: Modify forecasts and assumptions in the editable yellow cells (WACC, growth, margins).
- Step 4: Instantly see the updated results, including Chemomab Therapeutics Ltd.'s (CMMB) intrinsic value.
- Step 5: Make well-informed investment decisions or create reports based on the outputs.
Why Choose This Calculator for Chemomab Therapeutics Ltd. (CMMB)?
- Designed for Industry Experts: A specialized tool crafted for biopharma analysts, financial officers, and consultants.
- Accurate Data: Chemomab’s historical and projected financials are preloaded for precision.
- Flexible Scenario Analysis: Effortlessly simulate various forecasts and assumptions.
- Comprehensive Outputs: Automatically computes intrinsic value, NPV, and critical financial metrics.
- User-Friendly: Clear, step-by-step instructions make the process straightforward.
Who Should Use This Product?
- Investors: Assess Chemomab Therapeutics Ltd.'s (CMMB) potential for investment opportunities.
- CFOs and Financial Analysts: Optimize valuation methodologies and evaluate financial forecasts for CMMB.
- Startup Founders: Understand the valuation strategies of biotechnology firms like Chemomab Therapeutics Ltd. (CMMB).
- Consultants: Create comprehensive valuation reports tailored for clients in the biotech sector.
- Students and Educators: Utilize real-time data from Chemomab Therapeutics Ltd. (CMMB) to teach and practice valuation concepts.
What the Template Contains
- Pre-Filled DCF Model: Chemomab Therapeutics Ltd.’s (CMMB) financial data preloaded for immediate use.
- WACC Calculator: Detailed calculations for Weighted Average Cost of Capital.
- Financial Ratios: Evaluate Chemomab Therapeutics Ltd.’s (CMMB) profitability, leverage, and efficiency.
- Editable Inputs: Change assumptions such as growth, margins, and CAPEX to fit your scenarios.
- Financial Statements: Annual and quarterly reports to support detailed analysis.
- Interactive Dashboard: Easily visualize key valuation metrics and results.
Disclaimer
All information, articles, and product details provided on this website are for general informational and educational purposes only. We do not claim any ownership over, nor do we intend to infringe upon, any trademarks, copyrights, logos, brand names, or other intellectual property mentioned or depicted on this site. Such intellectual property remains the property of its respective owners, and any references here are made solely for identification or informational purposes, without implying any affiliation, endorsement, or partnership.
We make no representations or warranties, express or implied, regarding the accuracy, completeness, or suitability of any content or products presented. Nothing on this website should be construed as legal, tax, investment, financial, medical, or other professional advice. In addition, no part of this site—including articles or product references—constitutes a solicitation, recommendation, endorsement, advertisement, or offer to buy or sell any securities, franchises, or other financial instruments, particularly in jurisdictions where such activity would be unlawful.
All content is of a general nature and may not address the specific circumstances of any individual or entity. It is not a substitute for professional advice or services. Any actions you take based on the information provided here are strictly at your own risk. You accept full responsibility for any decisions or outcomes arising from your use of this website and agree to release us from any liability in connection with your use of, or reliance upon, the content or products found herein.