
|
Cimpress PLC (CMPR) Avaliação DCF |
Totalmente Editável: Adapte-Se Às Suas Necessidades No Excel Ou Planilhas
Design Profissional: Modelos Confiáveis E Padrão Da Indústria
Pré-Construídos Para Uso Rápido E Eficiente
Compatível com MAC/PC, totalmente desbloqueado
Não É Necessária Experiência; Fácil De Seguir
Cimpress plc (CMPR) Bundle
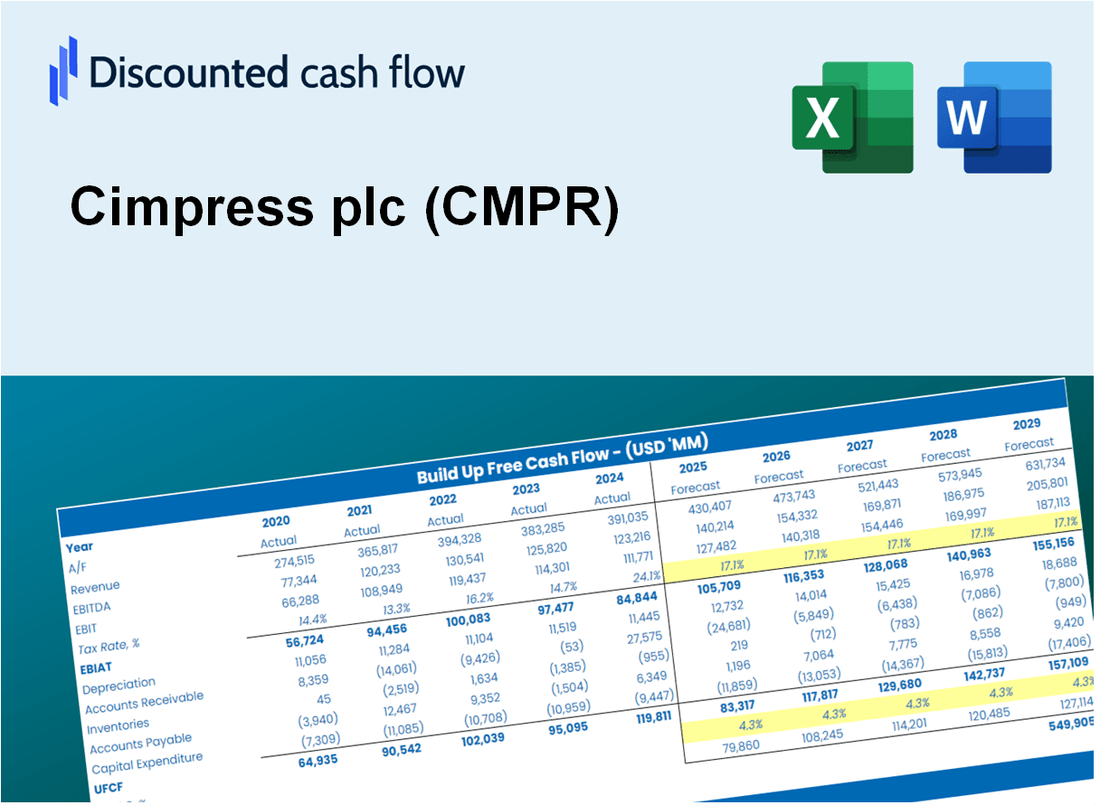
Avalie as perspectivas financeiras do Cimpress PLC (CMPR) como um especialista! Essa calculadora DCF (CMPR) fornece dados financeiros pré-preenchidos e permite a flexibilidade de modificar o crescimento da receita, o WACC, as margens e outras suposições essenciais para se alinhar com suas projeções.
What You Will Get
- Real Cimpress Data: Preloaded financials – from revenue to EBIT – based on actual and projected figures for Cimpress plc (CMPR).
- Full Customization: Adjust all critical parameters (yellow cells) like WACC, growth %, and tax rates specific to Cimpress plc (CMPR).
- Instant Valuation Updates: Automatic recalculations to analyze the impact of changes on Cimpress plc (CMPR)’s fair value.
- Versatile Excel Template: Tailored for quick edits, scenario testing, and detailed projections for Cimpress plc (CMPR).
- Time-Saving and Accurate: Skip building models from scratch while maintaining precision and flexibility for Cimpress plc (CMPR).
Key Features
- Comprehensive Financial Data: Access Cimpress plc’s historical financial reports and pre-populated forecasts.
- Customizable Parameters: Adjust WACC, tax rates, revenue growth, and EBITDA margins as needed.
- Real-Time Valuation: Watch Cimpress plc’s intrinsic value update instantly.
- Intuitive Visual Representations: Dashboard charts showcase valuation outcomes and essential metrics.
- Designed for Precision: A reliable tool tailored for analysts, investors, and finance professionals.
How It Works
- Step 1: Download the Excel file.
- Step 2: Review pre-entered Cimpress plc (CMPR) data (historical and projected).
- Step 3: Adjust key assumptions (yellow cells) based on your analysis.
- Step 4: View automatic recalculations for Cimpress plc (CMPR)’s intrinsic value.
- Step 5: Use the outputs for investment decisions or reporting.
Why Choose This Calculator?
- User-Friendly Interface: Perfectly crafted for both novices and seasoned users.
- Customizable Inputs: Adjust parameters effortlessly to suit your analysis needs.
- Real-Time Adjustments: Witness immediate updates to Cimpress plc’s (CMPR) valuation as you modify inputs.
- Preconfigured Data: Comes with Cimpress plc’s (CMPR) actual financial information for swift evaluations.
- Relied Upon by Experts: A go-to tool for investors and analysts aiming for well-informed decisions.
Who Should Use This Product?
- Professional Investors: Develop comprehensive and accurate valuation models for portfolio assessment related to Cimpress plc (CMPR).
- Corporate Finance Teams: Evaluate valuation scenarios to inform strategic decisions within the organization.
- Consultants and Advisors: Deliver precise valuation insights for clients interested in Cimpress plc (CMPR).
- Students and Educators: Utilize real-world data for practicing and teaching financial modeling techniques.
- Tech Enthusiasts: Gain insights into how companies like Cimpress plc (CMPR) are valued in the tech market.
What the Template Contains
- Comprehensive DCF Model: Editable template featuring in-depth valuation calculations.
- Real-World Data: Cimpress plc’s (CMPR) historical and projected financials preloaded for analysis.
- Customizable Parameters: Modify WACC, growth rates, and tax assumptions to explore various scenarios.
- Financial Statements: Complete annual and quarterly breakdowns for enhanced insights.
- Key Ratios: Integrated analysis for profitability, efficiency, and leverage metrics.
- Dashboard with Visual Outputs: Visualizations and tables for clear, actionable insights.
Disclaimer
All information, articles, and product details provided on this website are for general informational and educational purposes only. We do not claim any ownership over, nor do we intend to infringe upon, any trademarks, copyrights, logos, brand names, or other intellectual property mentioned or depicted on this site. Such intellectual property remains the property of its respective owners, and any references here are made solely for identification or informational purposes, without implying any affiliation, endorsement, or partnership.
We make no representations or warranties, express or implied, regarding the accuracy, completeness, or suitability of any content or products presented. Nothing on this website should be construed as legal, tax, investment, financial, medical, or other professional advice. In addition, no part of this site—including articles or product references—constitutes a solicitation, recommendation, endorsement, advertisement, or offer to buy or sell any securities, franchises, or other financial instruments, particularly in jurisdictions where such activity would be unlawful.
All content is of a general nature and may not address the specific circumstances of any individual or entity. It is not a substitute for professional advice or services. Any actions you take based on the information provided here are strictly at your own risk. You accept full responsibility for any decisions or outcomes arising from your use of this website and agree to release us from any liability in connection with your use of, or reliance upon, the content or products found herein.