
|
CMS Info Systems Limited (CMSINFO.NS) Avaliação DCF |
Totalmente Editável: Adapte-Se Às Suas Necessidades No Excel Ou Planilhas
Design Profissional: Modelos Confiáveis E Padrão Da Indústria
Pré-Construídos Para Uso Rápido E Eficiente
Compatível com MAC/PC, totalmente desbloqueado
Não É Necessária Experiência; Fácil De Seguir
CMS Info Systems Limited (CMSINFO.NS) Bundle
Aprimore suas estratégias de investimento com o CMS Info Systems Limited (CMSINFONS) DCF Calculator! Mergulhe em dados financeiros genuínos do CMS, ajuste as previsões e despesas do crescimento e observe instantaneamente como essas modificações afetam o valor intrínseco da CMS Info Systems Limited.
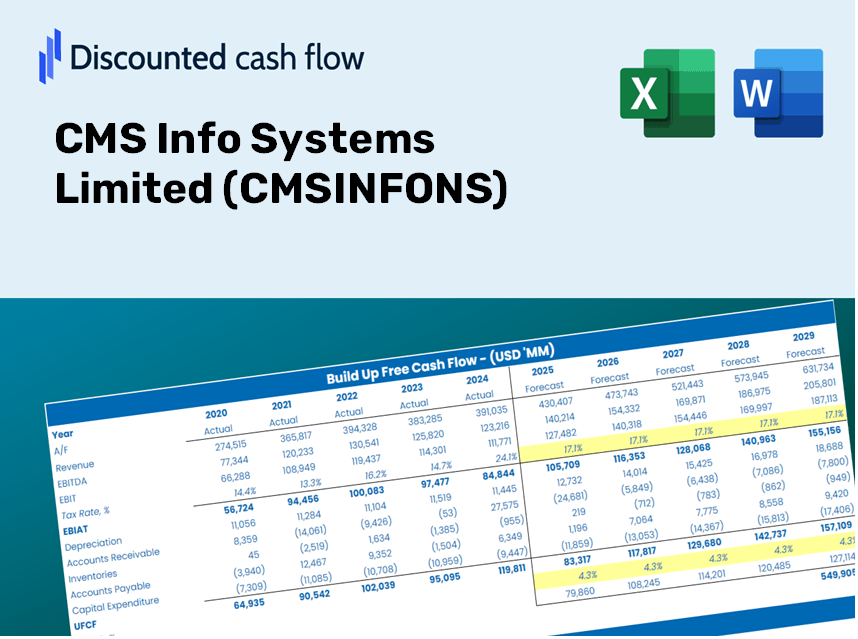
Discounted Cash Flow (DCF) - (USD MM)
| Year | AY1 2021 |
AY2 2022 |
AY3 2023 |
AY4 2024 |
AY5 2025 |
FY1 2026 |
FY2 2027 |
FY3 2028 |
FY4 2029 |
FY5 2030 |
|---|---|---|---|---|---|---|---|---|---|---|
| Revenue | 13,060.9 | 15,896.7 | 19,147.3 | 22,646.8 | 24,245.3 | 28,336.5 | 33,117.9 | 38,706.2 | 45,237.4 | 52,870.8 |
| Revenue Growth, % | 0 | 21.71 | 20.45 | 18.28 | 7.06 | 16.87 | 16.87 | 16.87 | 16.87 | 16.87 |
| EBITDA | 3,094.4 | 4,076.8 | 5,524.5 | 6,334.9 | 5,804.0 | 7,373.2 | 8,617.4 | 10,071.4 | 11,770.9 | 13,757.1 |
| EBITDA, % | 23.69 | 25.65 | 28.85 | 27.97 | 23.94 | 26.02 | 26.02 | 26.02 | 26.02 | 26.02 |
| Depreciation | 634.6 | 918.4 | 1,318.2 | 1,502.1 | 1,150.5 | 1,637.8 | 1,914.1 | 2,237.1 | 2,614.6 | 3,055.8 |
| Depreciation, % | 4.86 | 5.78 | 6.88 | 6.63 | 4.75 | 5.78 | 5.78 | 5.78 | 5.78 | 5.78 |
| EBIT | 2,459.8 | 3,158.4 | 4,206.3 | 4,832.7 | 4,653.5 | 5,735.5 | 6,703.2 | 7,834.3 | 9,156.3 | 10,701.3 |
| EBIT, % | 18.83 | 19.87 | 21.97 | 21.34 | 19.19 | 20.24 | 20.24 | 20.24 | 20.24 | 20.24 |
| Total Cash | 3,068.0 | 2,847.4 | 4,047.0 | 6,251.4 | 7,864.6 | 6,946.9 | 8,119.2 | 9,489.2 | 11,090.4 | 12,961.8 |
| Total Cash, percent | .0 | .0 | .0 | .0 | .0 | .0 | .0 | .0 | .0 | .0 |
| Account Receivables | 5,007.2 | 5,802.0 | 5,886.2 | 7,828.4 | 8,145.6 | 9,846.4 | 11,507.8 | 13,449.7 | 15,719.2 | 18,371.6 |
| Account Receivables, % | 38.34 | 36.5 | 30.74 | 34.57 | 33.6 | 34.75 | 34.75 | 34.75 | 34.75 | 34.75 |
| Inventories | 894.7 | 634.8 | 741.7 | 1,268.6 | 795.8 | 1,337.6 | 1,563.3 | 1,827.1 | 2,135.4 | 2,495.7 |
| Inventories, % | 6.85 | 3.99 | 3.87 | 5.6 | 3.28 | 4.72 | 4.72 | 4.72 | 4.72 | 4.72 |
| Accounts Payable | 3,061.6 | 629.1 | 920.8 | 2,607.7 | 3,500.9 | 3,296.2 | 3,852.4 | 4,502.4 | 5,262.2 | 6,150.1 |
| Accounts Payable, % | 23.44 | 3.96 | 4.81 | 11.51 | 14.44 | 11.63 | 11.63 | 11.63 | 11.63 | 11.63 |
| Capital Expenditure | -550.9 | -2,839.7 | -1,933.2 | -1,083.8 | -1,543.4 | -2,455.5 | -2,869.9 | -3,354.2 | -3,920.1 | -4,581.6 |
| Capital Expenditure, % | -4.22 | -17.86 | -10.1 | -4.79 | -6.37 | -8.67 | -8.67 | -8.67 | -8.67 | -8.67 |
| Tax Rate, % | 25.19 | 25.19 | 25.19 | 25.19 | 25.19 | 25.19 | 25.19 | 25.19 | 25.19 | 25.19 |
| EBITAT | 1,743.6 | 2,347.3 | 3,117.7 | 3,591.9 | 3,481.5 | 4,226.6 | 4,939.8 | 5,773.4 | 6,747.5 | 7,886.1 |
| Depreciation | ||||||||||
| Changes in Account Receivables | ||||||||||
| Changes in Inventories | ||||||||||
| Changes in Accounts Payable | ||||||||||
| Capital Expenditure | ||||||||||
| UFCF | -1,013.1 | -2,541.2 | 2,603.4 | 3,228.0 | 4,137.6 | 961.5 | 2,653.1 | 3,100.7 | 3,624.0 | 4,235.5 |
| WACC, % | 4.76 | 4.77 | 4.77 | 4.77 | 4.78 | 4.77 | 4.77 | 4.77 | 4.77 | 4.77 |
| PV UFCF | ||||||||||
| SUM PV UFCF | 12,392.9 | |||||||||
| Long Term Growth Rate, % | 3.00 | |||||||||
| Free cash flow (T + 1) | 4,363 | |||||||||
| Terminal Value | 246,174 | |||||||||
| Present Terminal Value | 194,991 | |||||||||
| Enterprise Value | 207,384 | |||||||||
| Net Debt | -1,061 | |||||||||
| Equity Value | 208,445 | |||||||||
| Diluted Shares Outstanding, MM | 167 | |||||||||
| Equity Value Per Share | 1,251.37 |
What You Will Receive
- Authentic CMSINFONS Financials: Features both historical and projected data for precise valuation.
- Customizable Inputs: Adjust WACC, tax rates, revenue growth, and capital expenditures as needed.
- Dynamic Calculations: Intrinsic value and NPV are calculated in real-time.
- Scenario Analysis: Explore various scenarios to assess CMS Info Systems Limited's future performance.
- User-Friendly Design: Tailored for professionals while remaining approachable for newcomers.
Key Features of CMS Info Systems Limited (CMSINFONS)
- Customizable Forecast Inputs: Adjust essential parameters such as revenue growth, EBITDA margins, and capital expenditures.
- Instant DCF Valuation: Quickly computes intrinsic value, NPV, and additional metrics with ease.
- High-Precision Accuracy: Leverages CMS Info Systems' real financial data for credible valuation results.
- Effortless Scenario Analysis: Easily evaluate different assumptions and analyze their impacts side by side.
- Efficiency Booster: Avoid the complexity of developing intricate valuation models from the ground up.
How It Works
- Download: Obtain the pre-configured Excel file featuring CMS Info Systems Limited’s (CMSINFONS) financial data.
- Customize: Modify projections such as revenue growth, EBITDA percentage, and WACC according to your needs.
- Update Automatically: Watch as intrinsic value and NPV calculations refresh in real-time.
- Test Scenarios: Develop various forecasts and analyze the results instantly.
- Make Decisions: Leverage the valuation insights to shape your investment approach.
Why Choose This Calculator for CMS Info Systems Limited (CMSINFONS)?
- Designed for Experts: A sophisticated tool utilized by analysts, CFOs, and consultants.
- Comprehensive Data: Historical and projected financials for CMS Info Systems are preloaded for precision.
- Scenario Analysis: Effortlessly simulate various forecasts and assumptions.
- Concise Results: Automatically determines intrinsic value, NPV, and essential metrics.
- User-Friendly: Step-by-step guidance walks you through the entire process.
Who Can Benefit from CMS Info Systems Limited (CMSINFONS)?
- Individual Investors: Gain valuable insights for making informed decisions on buying or selling shares of CMS Info Systems Limited (CMSINFONS).
- Financial Analysts: Enhance valuation accuracy with accessible financial models tailored for CMS Info Systems Limited (CMSINFONS).
- Consultants: Provide timely and precise valuation assessments to clients regarding CMS Info Systems Limited (CMSINFONS).
- Business Owners: Learn how leading companies like CMS Info Systems Limited (CMSINFONS) are valued to inform your own business strategies.
- Finance Students: Explore real-world valuation methods using data and scenarios from CMS Info Systems Limited (CMSINFONS).
Overview of the Template
- Pre-Filled Data: Contains CMS Info Systems Limited's historical financial performance and future projections.
- Discounted Cash Flow Model: An editable DCF valuation model with automated calculations.
- Weighted Average Cost of Capital (WACC): A specific sheet designed for WACC calculations based on user-defined inputs.
- Key Financial Ratios: Evaluate the profitability, efficiency, and leverage of CMS Info Systems Limited (CMSINFONS).
- Customizable Inputs: Easily modify assumptions for revenue growth, margins, and tax rates.
- Comprehensive Dashboard: Visual representations and tables that summarize crucial valuation findings.
Disclaimer
All information, articles, and product details provided on this website are for general informational and educational purposes only. We do not claim any ownership over, nor do we intend to infringe upon, any trademarks, copyrights, logos, brand names, or other intellectual property mentioned or depicted on this site. Such intellectual property remains the property of its respective owners, and any references here are made solely for identification or informational purposes, without implying any affiliation, endorsement, or partnership.
We make no representations or warranties, express or implied, regarding the accuracy, completeness, or suitability of any content or products presented. Nothing on this website should be construed as legal, tax, investment, financial, medical, or other professional advice. In addition, no part of this site—including articles or product references—constitutes a solicitation, recommendation, endorsement, advertisement, or offer to buy or sell any securities, franchises, or other financial instruments, particularly in jurisdictions where such activity would be unlawful.
All content is of a general nature and may not address the specific circumstances of any individual or entity. It is not a substitute for professional advice or services. Any actions you take based on the information provided here are strictly at your own risk. You accept full responsibility for any decisions or outcomes arising from your use of this website and agree to release us from any liability in connection with your use of, or reliance upon, the content or products found herein.