
|
ZW Data Action Technologies Inc. (CNET) Avaliação DCF |
Totalmente Editável: Adapte-Se Às Suas Necessidades No Excel Ou Planilhas
Design Profissional: Modelos Confiáveis E Padrão Da Indústria
Pré-Construídos Para Uso Rápido E Eficiente
Compatível com MAC/PC, totalmente desbloqueado
Não É Necessária Experiência; Fácil De Seguir
ZW Data Action Technologies Inc. (CNET) Bundle
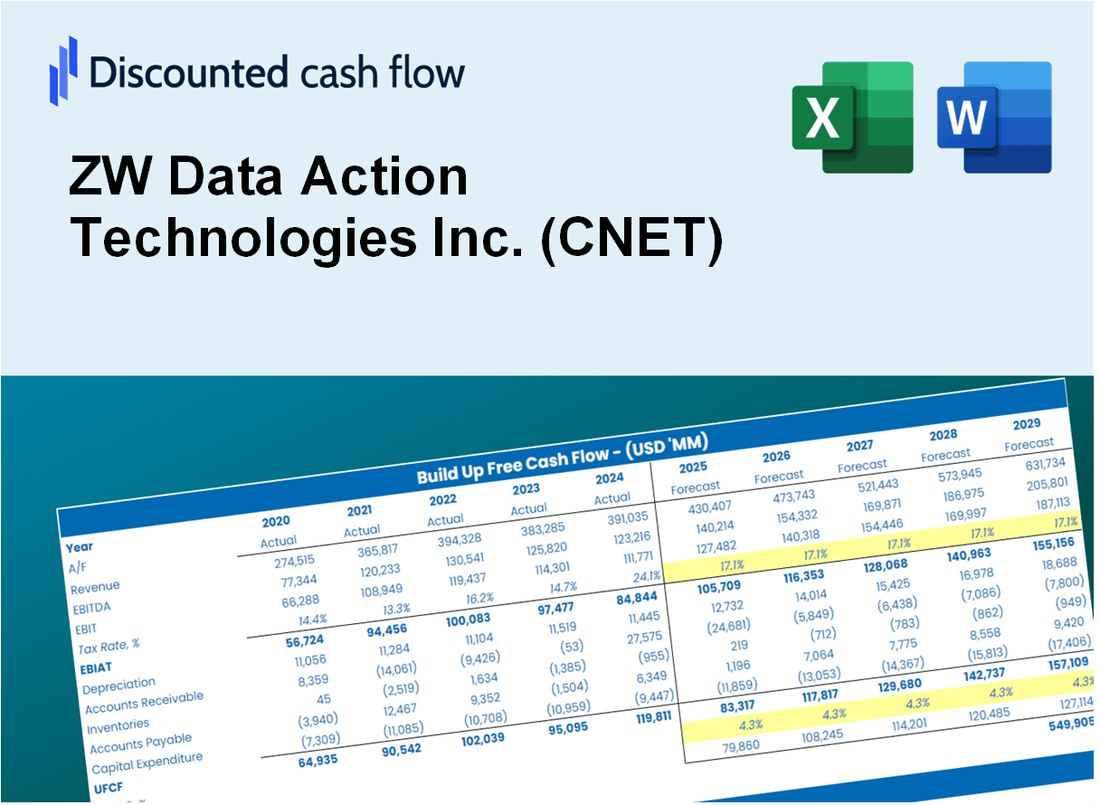
Simplifique sua análise e melhore a precisão com a nossa calculadora CNET DCF! Utilizando dados reais da ZW Data Action Technologies Inc. e suposições personalizáveis, essa ferramenta o capacita a prever, avaliar e valorizar a CNET como um investidor experiente.
What You Will Get
- Genuine ZW Data Insights: Preloaded financials – encompassing revenue and EBIT – derived from actual and projected data.
- Comprehensive Customization: Modify all essential parameters (yellow cells) such as WACC, growth %, and tax rates.
- Instant Valuation Adjustments: Automatic recalculations to assess the effects of changes on ZW Data's fair value.
- Flexible Excel Template: Designed for quick modifications, scenario analysis, and in-depth projections.
- Efficient and Precise: Avoid the hassle of building models from the ground up while ensuring accuracy and adaptability.
Key Features
- Comprehensive CNET Data: Pre-filled with ZW Data Action Technologies Inc.'s historical performance and future projections.
- Flexible Input Options: Modify parameters such as revenue growth, profit margins, discount rates, tax implications, and capital investments.
- Interactive Valuation Framework: Automatic recalculations of Net Present Value (NPV) and intrinsic value based on your specified inputs.
- Scenario Analysis: Develop various forecasting scenarios to evaluate different valuation results.
- Intuitive User Interface: Designed to be straightforward and accessible for both experienced professionals and newcomers.
How It Works
- Step 1: Download the Excel file.
- Step 2: Review pre-entered ZW Data Action Technologies Inc. (CNET) data (historical and projected).
- Step 3: Adjust key assumptions (yellow cells) based on your analysis.
- Step 4: View automatic recalculations for ZW Data Action Technologies Inc. (CNET)’s intrinsic value.
- Step 5: Use the outputs for investment decisions or reporting.
Why Choose ZW Data Action Technologies Inc. (CNET) Calculator?
- Designed for Experts: A sophisticated tool utilized by data analysts, financial officers, and industry consultants.
- Accurate Data Sources: CNET’s historical and projected financial data integrated for reliable results.
- Comprehensive Scenario Analysis: Effortlessly simulate various forecasts and assumptions.
- Insightful Outputs: Automatically computes intrinsic value, NPV, and other essential metrics.
- User-Friendly Interface: Step-by-step guidance simplifies the calculation process.
Who Should Use ZW Data Action Technologies Inc. (CNET)?
- Investors: Gain insights and make informed decisions with advanced data analytics tools.
- Data Analysts: Streamline your workflow with comprehensive data management solutions.
- Consultants: Easily tailor reports and presentations for your clients using our robust platforms.
- Tech Enthusiasts: Explore innovative data technologies and enhance your skills with practical applications.
- Educators and Students: Leverage our tools for hands-on learning in data science and technology courses.
What the Template Contains
- Pre-Filled DCF Model: ZW Data Action Technologies Inc.'s (CNET) financial data preloaded for immediate use.
- WACC Calculator: Detailed calculations for Weighted Average Cost of Capital.
- Financial Ratios: Evaluate ZW Data Action Technologies Inc.'s (CNET) profitability, leverage, and efficiency.
- Editable Inputs: Change assumptions such as growth, margins, and CAPEX to fit your scenarios.
- Financial Statements: Annual and quarterly reports to support detailed analysis.
- Interactive Dashboard: Easily visualize key valuation metrics and results.
Disclaimer
All information, articles, and product details provided on this website are for general informational and educational purposes only. We do not claim any ownership over, nor do we intend to infringe upon, any trademarks, copyrights, logos, brand names, or other intellectual property mentioned or depicted on this site. Such intellectual property remains the property of its respective owners, and any references here are made solely for identification or informational purposes, without implying any affiliation, endorsement, or partnership.
We make no representations or warranties, express or implied, regarding the accuracy, completeness, or suitability of any content or products presented. Nothing on this website should be construed as legal, tax, investment, financial, medical, or other professional advice. In addition, no part of this site—including articles or product references—constitutes a solicitation, recommendation, endorsement, advertisement, or offer to buy or sell any securities, franchises, or other financial instruments, particularly in jurisdictions where such activity would be unlawful.
All content is of a general nature and may not address the specific circumstances of any individual or entity. It is not a substitute for professional advice or services. Any actions you take based on the information provided here are strictly at your own risk. You accept full responsibility for any decisions or outcomes arising from your use of this website and agree to release us from any liability in connection with your use of, or reliance upon, the content or products found herein.