
|
Coda Octopus Group, Inc. (Coda) Avaliação DCF |
Totalmente Editável: Adapte-Se Às Suas Necessidades No Excel Ou Planilhas
Design Profissional: Modelos Confiáveis E Padrão Da Indústria
Pré-Construídos Para Uso Rápido E Eficiente
Compatível com MAC/PC, totalmente desbloqueado
Não É Necessária Experiência; Fácil De Seguir
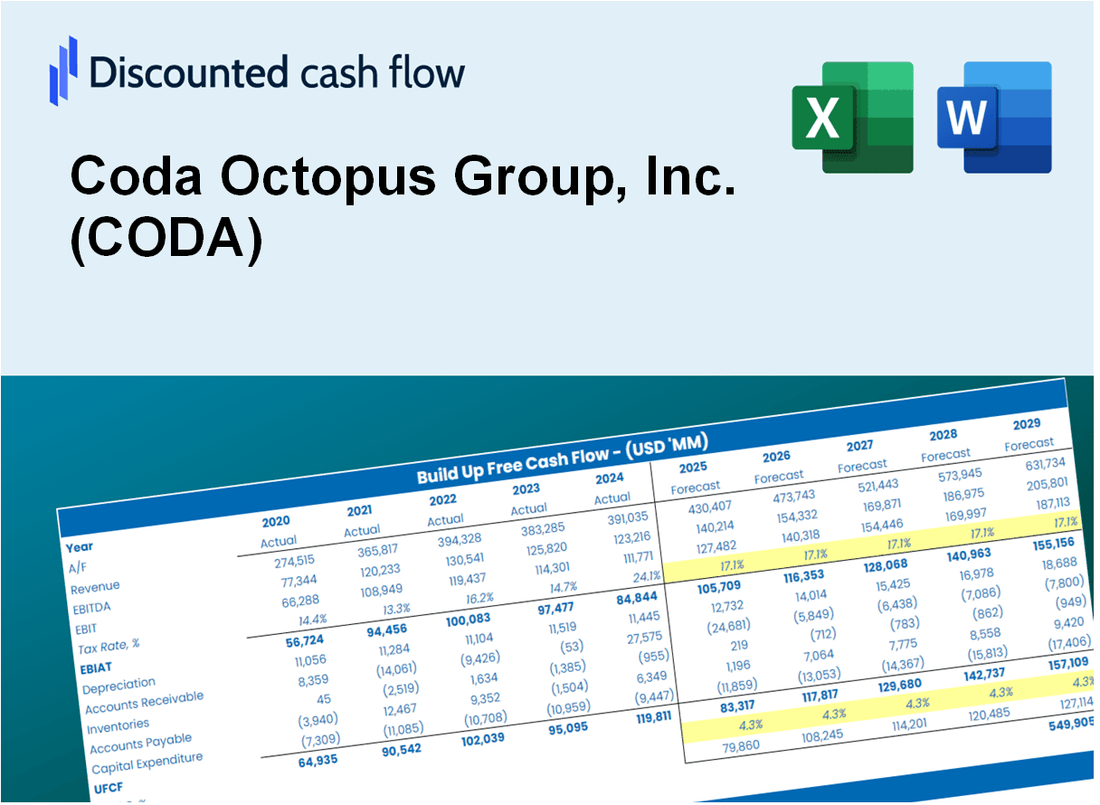
Coda Octopus Group, Inc. (CODA) Bundle
Seja você um investidor ou analista, esta calculadora DCF (Coda) é o seu recurso preferido para uma avaliação precisa. Carregado com dados reais do Coda Octopus Group, Inc., você pode ajustar as previsões e observar instantaneamente seus efeitos.
Discounted Cash Flow (DCF) - (USD MM)
| Year | AY1 2020 |
AY2 2021 |
AY3 2022 |
AY4 2023 |
AY5 2024 |
FY1 2025 |
FY2 2026 |
FY3 2027 |
FY4 2028 |
FY5 2029 |
|---|---|---|---|---|---|---|---|---|---|---|
| Revenue | 20.0 | 21.3 | 22.2 | 19.4 | 20.3 | 20.5 | 20.6 | 20.7 | 20.9 | 21.0 |
| Revenue Growth, % | 0 | 6.42 | 4.19 | -12.93 | 4.98 | 0.66723 | 0.66723 | 0.66723 | 0.66723 | 0.66723 |
| EBITDA | 4.3 | 6.2 | 5.9 | 4.1 | 4.4 | 4.9 | 4.9 | 5.0 | 5.0 | 5.0 |
| EBITDA, % | 21.33 | 29.05 | 26.46 | 21.13 | 21.87 | 23.97 | 23.97 | 23.97 | 23.97 | 23.97 |
| Depreciation | .8 | .9 | .7 | .7 | .8 | .8 | .8 | .8 | .8 | .8 |
| Depreciation, % | 4.01 | 4.33 | 3.32 | 3.45 | 3.79 | 3.78 | 3.78 | 3.78 | 3.78 | 3.78 |
| EBIT | 3.5 | 5.3 | 5.1 | 3.4 | 3.7 | 4.1 | 4.2 | 4.2 | 4.2 | 4.2 |
| EBIT, % | 17.32 | 24.72 | 23.14 | 17.68 | 18.08 | 20.19 | 20.19 | 20.19 | 20.19 | 20.19 |
| Total Cash | 15.1 | 17.7 | 22.9 | 24.4 | 22.5 | 18.8 | 18.9 | 19.0 | 19.1 | 19.3 |
| Total Cash, percent | .0 | .0 | .0 | .0 | .0 | .0 | .0 | .0 | .0 | .0 |
| Account Receivables | 3.0 | 5.3 | 3.8 | 4.3 | 5.7 | 4.4 | 4.4 | 4.5 | 4.5 | 4.5 |
| Account Receivables, % | 15 | 24.79 | 17.08 | 22.41 | 28.13 | 21.48 | 21.48 | 21.48 | 21.48 | 21.48 |
| Inventories | 9.1 | 10.7 | 10.0 | 11.7 | 14.0 | 11.0 | 11.1 | 11.2 | 11.3 | 11.3 |
| Inventories, % | 45.61 | 50.12 | 45.11 | 60.38 | 68.79 | 54 | 54 | 54 | 54 | 54 |
| Accounts Payable | 1.3 | 1.5 | .8 | 1.3 | 1.0 | 1.2 | 1.2 | 1.2 | 1.2 | 1.2 |
| Accounts Payable, % | 6.41 | 6.82 | 3.57 | 6.76 | 5.09 | 5.73 | 5.73 | 5.73 | 5.73 | 5.73 |
| Capital Expenditure | -1.0 | -1.0 | -.6 | -2.1 | -.6 | -1.1 | -1.1 | -1.1 | -1.1 | -1.1 |
| Capital Expenditure, % | -4.98 | -4.52 | -2.5 | -11.01 | -2.91 | -5.19 | -5.19 | -5.19 | -5.19 | -5.19 |
| Tax Rate, % | 20.93 | 20.93 | 20.93 | 20.93 | 20.93 | 20.93 | 20.93 | 20.93 | 20.93 | 20.93 |
| EBITAT | 3.4 | 5.0 | 4.3 | 3.1 | 2.9 | 3.7 | 3.7 | 3.7 | 3.8 | 3.8 |
| Depreciation | ||||||||||
| Changes in Account Receivables | ||||||||||
| Changes in Inventories | ||||||||||
| Changes in Accounts Payable | ||||||||||
| Capital Expenditure | ||||||||||
| UFCF | -7.6 | 1.3 | 6.0 | .0 | -.9 | 7.8 | 3.3 | 3.4 | 3.4 | 3.4 |
| WACC, % | 6.57 | 6.57 | 6.57 | 6.57 | 6.56 | 6.57 | 6.57 | 6.57 | 6.57 | 6.57 |
| PV UFCF | ||||||||||
| SUM PV UFCF | 18.1 | |||||||||
| Long Term Growth Rate, % | 2.00 | |||||||||
| Free cash flow (T + 1) | 3 | |||||||||
| Terminal Value | 76 | |||||||||
| Present Terminal Value | 55 | |||||||||
| Enterprise Value | 73 | |||||||||
| Net Debt | -22 | |||||||||
| Equity Value | 95 | |||||||||
| Diluted Shares Outstanding, MM | 11 | |||||||||
| Equity Value Per Share | 8.44 |
What You Will Get
- Editable Excel Template: A fully customizable Excel-based DCF Calculator featuring pre-filled real CODA financials.
- Real-World Data: Historical data and forward-looking estimates (as highlighted in the yellow cells).
- Forecast Flexibility: Adjust forecast assumptions such as revenue growth, EBITDA %, and WACC.
- Automatic Calculations: Instantly observe the effect of your inputs on Coda Octopus Group's valuation.
- Professional Tool: Designed for investors, CFOs, consultants, and financial analysts.
- User-Friendly Design: Organized for clarity and ease of use, complete with step-by-step instructions.
Key Features
- Customizable Financial Metrics: Adjust essential inputs such as revenue projections, operating margins, and investment costs.
- Instant DCF Valuation: Automatically derives intrinsic value, net present value (NPV), and other key financial outputs.
- High-Precision Accuracy: Incorporates Coda Octopus Group's actual financial data for dependable valuation results.
- Simplified Scenario Testing: Evaluate various assumptions and analyze results effortlessly.
- Efficiency Booster: Streamline the valuation process without the need for intricate model development.
How It Works
- Download: Obtain the pre-prepared Excel file containing Coda Octopus Group, Inc.'s (CODA) financial data.
- Customize: Modify forecasts, such as revenue growth, EBITDA %, and WACC.
- Update Automatically: The intrinsic value and NPV calculations refresh in real-time.
- Test Scenarios: Generate various projections and compare results instantly.
- Make Decisions: Utilize the valuation findings to inform your investment approach.
Why Choose Coda Octopus Group, Inc. (CODA) Calculator?
- Accuracy: Utilizes real Coda Octopus financial data for precise calculations.
- Flexibility: Allows users to easily test and adjust inputs as needed.
- Time-Saving: Eliminate the complexity of constructing a DCF model from the ground up.
- Professional-Grade: Crafted with the expertise and usability expected at the CFO level.
- User-Friendly: Intuitive interface designed for users of all financial backgrounds.
Who Should Use Coda Octopus Group, Inc. (CODA)?
- Investors: Gain insights into underwater technology investments with advanced analytical tools.
- Marine Engineers: Utilize specialized solutions for project planning and execution in marine environments.
- Consultants: Customize presentations and reports for clients in the marine and defense sectors.
- Technology Enthusiasts: Explore cutting-edge innovations in underwater robotics and imaging technology.
- Educators and Students: Leverage real-world applications of marine technology in academic settings.
What the Template Contains
- Operating and Balance Sheet Data: Pre-filled Coda Octopus Group, Inc. (CODA) historical data and forecasts, including revenue, EBITDA, EBIT, and capital expenditures.
- WACC Calculation: A dedicated sheet for Weighted Average Cost of Capital (WACC), including parameters like Beta, risk-free rate, and share price.
- DCF Valuation (Unlevered and Levered): Editable Discounted Cash Flow models showing intrinsic value with detailed calculations.
- Financial Statements: Pre-loaded financial statements (annual and quarterly) to support analysis.
- Key Ratios: Includes profitability, leverage, and efficiency ratios for Coda Octopus Group, Inc. (CODA).
- Dashboard and Charts: Visual summary of valuation outputs and assumptions to analyze results easily.
Disclaimer
All information, articles, and product details provided on this website are for general informational and educational purposes only. We do not claim any ownership over, nor do we intend to infringe upon, any trademarks, copyrights, logos, brand names, or other intellectual property mentioned or depicted on this site. Such intellectual property remains the property of its respective owners, and any references here are made solely for identification or informational purposes, without implying any affiliation, endorsement, or partnership.
We make no representations or warranties, express or implied, regarding the accuracy, completeness, or suitability of any content or products presented. Nothing on this website should be construed as legal, tax, investment, financial, medical, or other professional advice. In addition, no part of this site—including articles or product references—constitutes a solicitation, recommendation, endorsement, advertisement, or offer to buy or sell any securities, franchises, or other financial instruments, particularly in jurisdictions where such activity would be unlawful.
All content is of a general nature and may not address the specific circumstances of any individual or entity. It is not a substitute for professional advice or services. Any actions you take based on the information provided here are strictly at your own risk. You accept full responsibility for any decisions or outcomes arising from your use of this website and agree to release us from any liability in connection with your use of, or reliance upon, the content or products found herein.