
|
Coface SA (COFA.PA) Avaliação DCF |
Totalmente Editável: Adapte-Se Às Suas Necessidades No Excel Ou Planilhas
Design Profissional: Modelos Confiáveis E Padrão Da Indústria
Pré-Construídos Para Uso Rápido E Eficiente
Compatível com MAC/PC, totalmente desbloqueado
Não É Necessária Experiência; Fácil De Seguir
COFACE SA (COFA.PA) Bundle
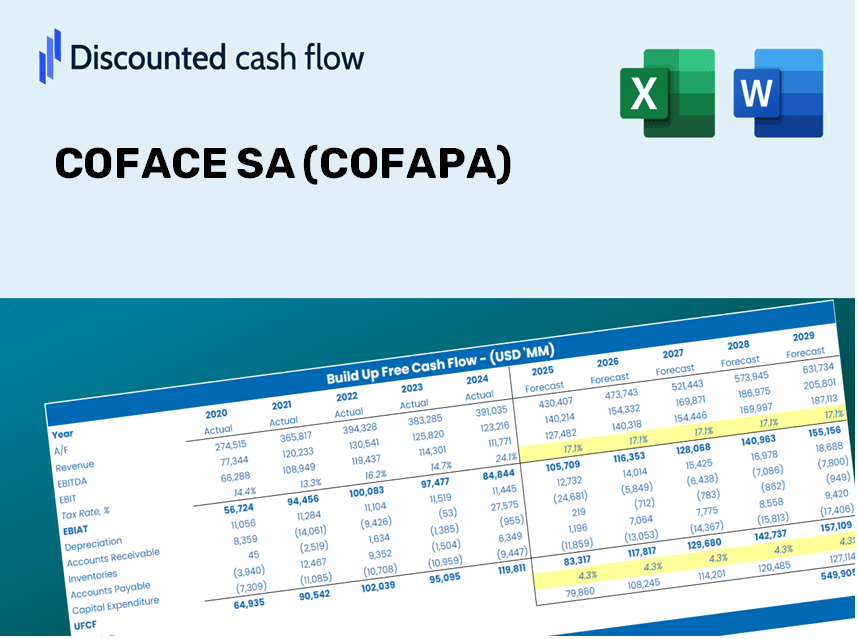
Obtenha uma visão da sua análise de avaliação do Coface SA (COFAPA) com nossa sofisticada calculadora DCF! Pré -carregado com dados reais da COFAPA, este modelo do Excel permite ajustar as previsões e suposições para determinar com precisão o valor intrínseco da Coface SA.
Discounted Cash Flow (DCF) - (USD MM)
| Year | AY1 2020 |
AY2 2021 |
AY3 2022 |
AY4 2023 |
AY5 2024 |
FY1 2025 |
FY2 2026 |
FY3 2027 |
FY4 2028 |
FY5 2029 |
|---|---|---|---|---|---|---|---|---|---|---|
| Revenue | 1,123.7 | 1,282.2 | 242.5 | 1,602.1 | 1,648.8 | 1,797.0 | 1,958.4 | 2,134.3 | 2,326.0 | 2,535.0 |
| Revenue Growth, % | 0 | 14.1 | -81.09 | 560.64 | 2.92 | 8.98 | 8.98 | 8.98 | 8.98 | 8.98 |
| EBITDA | 184.9 | 350.3 | 380.4 | 406.2 | 446.7 | 705.2 | 768.6 | 837.6 | 912.9 | 994.9 |
| EBITDA, % | 16.46 | 27.32 | 156.87 | 25.35 | 27.09 | 39.24 | 39.24 | 39.24 | 39.24 | 39.24 |
| Depreciation | 35.6 | 37.4 | 25.1 | 40.7 | 37.5 | 76.4 | 83.3 | 90.7 | 98.9 | 107.8 |
| Depreciation, % | 3.17 | 2.92 | 10.36 | 2.54 | 2.27 | 4.25 | 4.25 | 4.25 | 4.25 | 4.25 |
| EBIT | 149.3 | 312.9 | 355.3 | 365.5 | 409.2 | 666.0 | 725.9 | 791.1 | 862.2 | 939.6 |
| EBIT, % | 13.29 | 24.4 | 146.51 | 22.81 | 24.82 | 37.07 | 37.07 | 37.07 | 37.07 | 37.07 |
| Total Cash | 3,297.3 | 3,477.6 | 553.8 | 2,862.9 | 3,220.4 | 1,797.0 | 1,958.4 | 2,134.3 | 2,326.0 | 2,535.0 |
| Total Cash, percent | .0 | .0 | .0 | .0 | .0 | .0 | .0 | .0 | .0 | .0 |
| Account Receivables | .0 | .0 | .0 | .0 | 3,379.4 | 359.4 | 391.7 | 426.9 | 465.2 | 507.0 |
| Account Receivables, % | 0 | 0 | 0 | 0 | 204.96 | 20 | 20 | 20 | 20 | 20 |
| Inventories | .0 | .0 | .0 | .0 | .0 | .0 | .0 | .0 | .0 | .0 |
| Inventories, % | 0 | 0 | 0 | 0 | 0 | 0 | 0 | 0 | 0 | 0 |
| Accounts Payable | 213.5 | 1,199.8 | 1,132.5 | .0 | 1,403.2 | 1,069.8 | 1,165.9 | 1,270.7 | 1,384.8 | 1,509.2 |
| Accounts Payable, % | 19 | 93.57 | 467.01 | 0 | 85.1 | 59.54 | 59.54 | 59.54 | 59.54 | 59.54 |
| Capital Expenditure | -33.9 | -17.2 | -32.2 | -25.4 | -26.7 | -75.0 | -81.7 | -89.0 | -97.0 | -105.8 |
| Capital Expenditure, % | -3.02 | -1.34 | -13.29 | -1.59 | -1.62 | -4.17 | -4.17 | -4.17 | -4.17 | -4.17 |
| Tax Rate, % | 28.72 | 28.72 | 28.72 | 28.72 | 28.72 | 28.72 | 28.72 | 28.72 | 28.72 | 28.72 |
| EBITAT | 97.0 | 240.3 | 222.5 | 267.5 | 291.7 | 464.7 | 506.5 | 552.0 | 601.5 | 655.6 |
| Depreciation | ||||||||||
| Changes in Account Receivables | ||||||||||
| Changes in Inventories | ||||||||||
| Changes in Accounts Payable | ||||||||||
| Capital Expenditure | ||||||||||
| UFCF | 312.2 | 1,246.8 | 148.2 | -849.8 | -1,673.7 | 3,152.8 | 571.8 | 623.2 | 679.2 | 740.2 |
| WACC, % | 4.49 | 4.71 | 4.45 | 4.64 | 4.6 | 4.58 | 4.58 | 4.58 | 4.58 | 4.58 |
| PV UFCF | ||||||||||
| SUM PV UFCF | 5,242.3 | |||||||||
| Long Term Growth Rate, % | 2.00 | |||||||||
| Free cash flow (T + 1) | 755 | |||||||||
| Terminal Value | 29,300 | |||||||||
| Present Terminal Value | 23,426 | |||||||||
| Enterprise Value | 28,668 | |||||||||
| Net Debt | 1,284 | |||||||||
| Equity Value | 27,384 | |||||||||
| Diluted Shares Outstanding, MM | 149 | |||||||||
| Equity Value Per Share | 183.37 |
What You Will Receive
- Authentic COFACE SA Data: Comprehensive financials – encompassing revenue to EBIT – drawn from both actual and forecasted figures.
- Complete Customization: Modify all essential parameters (yellow cells) including WACC, growth %, and tax rates according to your needs.
- Immediate Valuation Updates: Automatic recalculations to assess the effects of adjustments on COFACE SA’s fair value.
- Flexible Excel Template: Designed for easy modifications, scenario analysis, and in-depth projections.
- Efficient and Precise: Eliminate the hassle of creating models from scratch while ensuring accuracy and adaptability.
Key Features
- Pre-Loaded Data: COFACE SA’s historical financial statements and pre-filled forecasts.
- Fully Adjustable Inputs: Modify WACC, tax rates, revenue growth, and EBITDA margins as needed.
- Instant Results: Watch COFACE SA’s intrinsic value update in real time.
- Clear Visual Outputs: Dashboard charts illustrate valuation results and essential metrics.
- Built for Accuracy: A professional tool designed for analysts, investors, and finance specialists.
How It Functions
- Download the Template: Gain immediate access to the Excel-based COFACE SA (COFAPA) DCF Calculator.
- Input Your Assumptions: Modify the yellow-highlighted cells to reflect growth rates, WACC, margins, and other variables.
- Instant Calculations: The model automatically recalculates COFACE SA’s intrinsic value.
- Test Scenarios: Experiment with various assumptions to assess potential changes in valuation.
- Analyze and Decide: Leverage the outcomes to inform your investment or financial analysis.
Why Choose This Calculator for COFACE SA (COFAPA)?
- All-in-One Solution: Integrates DCF, WACC, and financial ratio analyses seamlessly.
- Flexible Inputs: Modify the yellow-highlighted fields to explore different scenarios.
- In-Depth Analysis: Automatically computes COFACE SA’s intrinsic value and Net Present Value.
- Preloaded Information: Historical and projected data provide a solid foundation for analysis.
- High-Quality Standards: Perfect for financial analysts, investors, and business consultants.
Who Can Benefit from This Product?
- Investors: Assess COFACE SA's valuation before making stock transactions.
- CFOs and Financial Analysts: Enhance valuation workflows and evaluate forecasts.
- Startup Founders: Understand the valuation methods used for established public companies like COFACE SA (COFAPA).
- Consultants: Provide comprehensive valuation reports for clients utilizing COFACE SA (COFAPA) insights.
- Students and Educators: Utilize real-world data from COFACE SA (COFAPA) to practice and teach valuation approaches.
Contents of the Template
- Pre-Filled Data: Contains COFACE SA's historical financials and future projections.
- Discounted Cash Flow Model: Customizable DCF valuation model with automatic calculations.
- Weighted Average Cost of Capital (WACC): A separate sheet for calculating WACC using personalized inputs.
- Key Financial Ratios: Evaluate COFACE SA's profitability, efficiency, and leverage metrics.
- Customizable Inputs: Easily modify revenue growth rates, margins, and tax rates.
- Clear Dashboard: Visuals and tables summarizing essential valuation results.
Disclaimer
All information, articles, and product details provided on this website are for general informational and educational purposes only. We do not claim any ownership over, nor do we intend to infringe upon, any trademarks, copyrights, logos, brand names, or other intellectual property mentioned or depicted on this site. Such intellectual property remains the property of its respective owners, and any references here are made solely for identification or informational purposes, without implying any affiliation, endorsement, or partnership.
We make no representations or warranties, express or implied, regarding the accuracy, completeness, or suitability of any content or products presented. Nothing on this website should be construed as legal, tax, investment, financial, medical, or other professional advice. In addition, no part of this site—including articles or product references—constitutes a solicitation, recommendation, endorsement, advertisement, or offer to buy or sell any securities, franchises, or other financial instruments, particularly in jurisdictions where such activity would be unlawful.
All content is of a general nature and may not address the specific circumstances of any individual or entity. It is not a substitute for professional advice or services. Any actions you take based on the information provided here are strictly at your own risk. You accept full responsibility for any decisions or outcomes arising from your use of this website and agree to release us from any liability in connection with your use of, or reliance upon, the content or products found herein.