
|
Etn. Fr. Colruyt NV (Colr.Br) DCF Avaliação |
Totalmente Editável: Adapte-Se Às Suas Necessidades No Excel Ou Planilhas
Design Profissional: Modelos Confiáveis E Padrão Da Indústria
Pré-Construídos Para Uso Rápido E Eficiente
Compatível com MAC/PC, totalmente desbloqueado
Não É Necessária Experiência; Fácil De Seguir
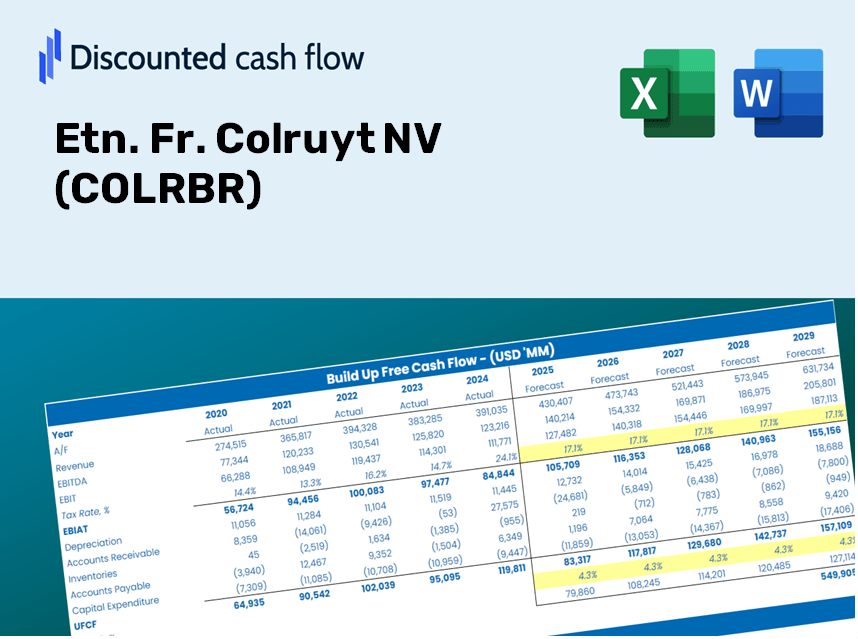
Etn. Fr. Colruyt NV (COLR.BR) Bundle
Descubra o verdadeiro potencial do ETN. Fr. Colruyt NV com nossa calculadora DCF de nível profissional! Ajuste as principais suposições, explore vários cenários e examine como as mudanças afetam o ETN. Fr. Avaliação de Colruyt NV - tudo dentro de um único modelo do Excel.
Benefits You Will Receive
- Flexible Input Adjustments: Easily modify key assumptions (growth %, profit margins, WACC) to explore various scenarios.
- Comprehensive Market Data: Etn. Fr. Colruyt NV’s (COLRBR) financial metrics pre-loaded to facilitate your analysis.
- Instant DCF Calculations: This template automatically computes Net Present Value (NPV) and intrinsic value for your convenience.
- Professional and Tailored: A refined Excel model that can be customized to suit your valuation requirements.
- Designed for Analysts and Investors: Perfect for evaluating forecasts, assessing strategies, and enhancing efficiency.
Key Features
- Accurate Financial Data for Etn. Fr. Colruyt NV: Gain access to reliable historical data and future forecasts.
- Adjustable Forecast Parameters: Modify highlighted cells for key metrics such as WACC, growth rates, and profit margins.
- Responsive Calculations: Instant updates for DCF, Net Present Value (NPV), and cash flow assessments.
- User-Friendly Dashboard: Intuitive charts and summaries for clear visualization of your valuation outcomes.
- Suited for All Experience Levels: Designed for investors, CFOs, and consultants with a straightforward, accessible layout.
How It Functions
- Download the Template: Gain immediate access to the Excel-based COLRBR DCF Calculator.
- Input Your Assumptions: Modify the yellow-highlighted cells for growth rates, WACC, margins, and other variables.
- Instant Calculations: The model automatically refreshes to reveal Etn. Fr. Colruyt NV’s intrinsic value.
- Test Scenarios: Experiment with various assumptions to assess potential changes in valuation.
- Analyze and Decide: Utilize the outcomes to inform your investment or financial analysis.
Why Choose This Calculator for Etn. Fr. Colruyt NV (COLRBR)?
- Precision: Utilizes authentic Etn. Fr. Colruyt NV financial data for reliable calculations.
- Versatility: Built to allow users to easily adjust and experiment with various inputs.
- Efficiency: Eliminate the need to create a DCF model from the ground up.
- High-Quality Standards: Crafted with accuracy and functionality akin to CFO-level requirements.
- Intuitive Design: Straightforward interface, perfect for users with varying levels of financial expertise.
Who Should Use This Product?
- Investors: Accurately assess the fair value of Etn. Fr. Colruyt NV (COLRBR) before making investment decisions.
- CFOs: Utilize a professional-grade DCF model for precise financial reporting and analysis related to Etn. Fr. Colruyt NV (COLRBR).
- Consultants: Seamlessly customize the template for valuation reports tailored to clients involving Etn. Fr. Colruyt NV (COLRBR).
- Entrepreneurs: Discover insights into financial modeling practices employed by leading companies like Etn. Fr. Colruyt NV (COLRBR).
- Educators: Incorporate it as a teaching resource to illustrate valuation methods relevant to Etn. Fr. Colruyt NV (COLRBR).
Overview of the Template's Features
- In-Depth DCF Model: Editable template featuring thorough valuation calculations.
- Historical and Projected Data: Etn. Fr. Colruyt NV’s (COLRBR) financial information preloaded for your analysis.
- Adjustable Variables: Tailor WACC, growth rates, and tax assumptions to explore various scenarios.
- Comprehensive Financial Statements: Complete annual and quarterly analyses for enhanced insights.
- Essential Ratios: Integrated assessments for profitability, efficiency, and leverage metrics.
- Interactive Dashboard: Visual charts and tables presenting clear, actionable insights.
Disclaimer
All information, articles, and product details provided on this website are for general informational and educational purposes only. We do not claim any ownership over, nor do we intend to infringe upon, any trademarks, copyrights, logos, brand names, or other intellectual property mentioned or depicted on this site. Such intellectual property remains the property of its respective owners, and any references here are made solely for identification or informational purposes, without implying any affiliation, endorsement, or partnership.
We make no representations or warranties, express or implied, regarding the accuracy, completeness, or suitability of any content or products presented. Nothing on this website should be construed as legal, tax, investment, financial, medical, or other professional advice. In addition, no part of this site—including articles or product references—constitutes a solicitation, recommendation, endorsement, advertisement, or offer to buy or sell any securities, franchises, or other financial instruments, particularly in jurisdictions where such activity would be unlawful.
All content is of a general nature and may not address the specific circumstances of any individual or entity. It is not a substitute for professional advice or services. Any actions you take based on the information provided here are strictly at your own risk. You accept full responsibility for any decisions or outcomes arising from your use of this website and agree to release us from any liability in connection with your use of, or reliance upon, the content or products found herein.