
|
Avaliação DCF de Holdings Inc. (CPS) Cooper-Standard Inc. |
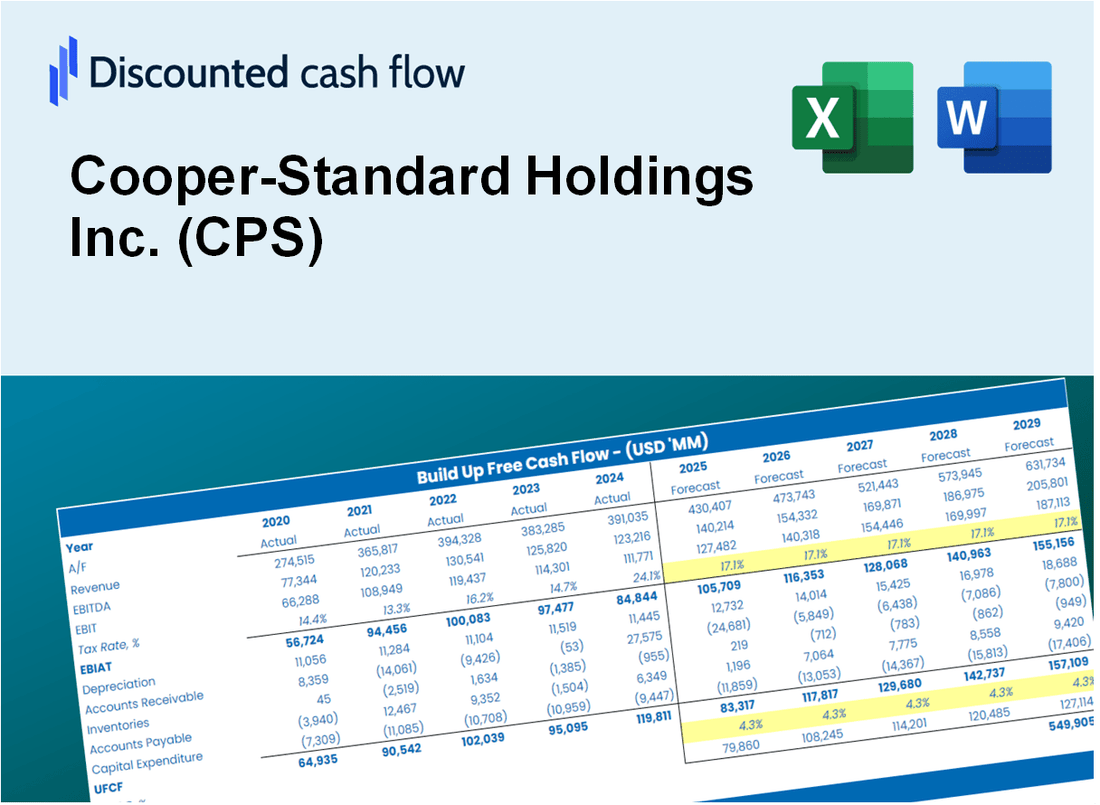
Totalmente Editável: Adapte-Se Às Suas Necessidades No Excel Ou Planilhas
Design Profissional: Modelos Confiáveis E Padrão Da Indústria
Pré-Construídos Para Uso Rápido E Eficiente
Compatível com MAC/PC, totalmente desbloqueado
Não É Necessária Experiência; Fácil De Seguir
Cooper-Standard Holdings Inc. (CPS) Bundle
Explore o futuro financeiro da Cooper-Standard Holdings Inc. (CPS) com nossa calculadora DCF amigável! Digite suas projeções de crescimento, margens e custos para calcular o valor intrínseco da Cooper-Standard Holdings Inc. (CPS) e aprimorar sua estratégia de investimento.
Discounted Cash Flow (DCF) - (USD MM)
| Year | AY1 2020 |
AY2 2021 |
AY3 2022 |
AY4 2023 |
AY5 2024 |
FY1 2025 |
FY2 2026 |
FY3 2027 |
FY4 2028 |
FY5 2029 |
|---|---|---|---|---|---|---|---|---|---|---|
| Revenue | 2,375.4 | 2,330.2 | 2,525.4 | 2,815.9 | 2,730.9 | 2,833.0 | 2,938.9 | 3,048.8 | 3,162.8 | 3,281.1 |
| Revenue Growth, % | 0 | -1.9 | 8.38 | 11.5 | -3.02 | 3.74 | 3.74 | 3.74 | 3.74 | 3.74 |
| EBITDA | -116.8 | -77.9 | .5 | 45.6 | 117.7 | -13.1 | -13.6 | -14.1 | -14.6 | -15.2 |
| EBITDA, % | -4.92 | -3.34 | 0.01940294 | 1.62 | 4.31 | -0.46239 | -0.46239 | -0.46239 | -0.46239 | -0.46239 |
| Depreciation | 154.2 | 139.0 | 122.5 | 109.9 | 103.6 | 141.7 | 147.0 | 152.5 | 158.2 | 164.1 |
| Depreciation, % | 6.49 | 5.97 | 4.85 | 3.9 | 3.79 | 5 | 5 | 5 | 5 | 5 |
| EBIT | -271.1 | -216.9 | -122.0 | -64.3 | 14.2 | -154.8 | -160.6 | -166.6 | -172.8 | -179.3 |
| EBIT, % | -11.41 | -9.31 | -4.83 | -2.28 | 0.51855 | -5.46 | -5.46 | -5.46 | -5.46 | -5.46 |
| Total Cash | 438.4 | 248.0 | 186.9 | 154.8 | 170.0 | 273.2 | 283.5 | 294.1 | 305.0 | 316.5 |
| Total Cash, percent | .0 | .0 | .0 | .0 | .0 | .0 | .0 | .0 | .0 | .0 |
| Account Receivables | 547.7 | 489.2 | 512.7 | 541.7 | 436.6 | 564.2 | 585.3 | 607.2 | 629.9 | 653.5 |
| Account Receivables, % | 23.06 | 20.99 | 20.3 | 19.24 | 15.99 | 19.92 | 19.92 | 19.92 | 19.92 | 19.92 |
| Inventories | 143.7 | 158.1 | 157.8 | 146.8 | 142.4 | 167.2 | 173.5 | 179.9 | 186.7 | 193.7 |
| Inventories, % | 6.05 | 6.78 | 6.25 | 5.21 | 5.21 | 5.9 | 5.9 | 5.9 | 5.9 | 5.9 |
| Accounts Payable | 385.3 | 348.1 | 338.2 | 334.6 | 295.2 | 381.0 | 395.2 | 410.0 | 425.4 | 441.3 |
| Accounts Payable, % | 16.22 | 14.94 | 13.39 | 11.88 | 10.81 | 13.45 | 13.45 | 13.45 | 13.45 | 13.45 |
| Capital Expenditure | -91.8 | -96.1 | -71.2 | -80.7 | -50.5 | -88.0 | -91.2 | -94.7 | -98.2 | -101.9 |
| Capital Expenditure, % | -3.86 | -4.12 | -2.82 | -2.87 | -1.85 | -3.1 | -3.1 | -3.1 | -3.1 | -3.1 |
| Tax Rate, % | 22.4 | 22.4 | 22.4 | 22.4 | 22.4 | 22.4 | 22.4 | 22.4 | 22.4 | 22.4 |
| EBITAT | -219.7 | -242.0 | -131.0 | -66.8 | 11.0 | -142.0 | -147.3 | -152.8 | -158.5 | -164.4 |
| Depreciation | ||||||||||
| Changes in Account Receivables | ||||||||||
| Changes in Inventories | ||||||||||
| Changes in Accounts Payable | ||||||||||
| Capital Expenditure | ||||||||||
| UFCF | -463.4 | -192.0 | -112.9 | -59.3 | 134.2 | -154.8 | -104.7 | -108.6 | -112.6 | -116.8 |
| WACC, % | 6.21 | 6.69 | 6.69 | 6.69 | 6.12 | 6.48 | 6.48 | 6.48 | 6.48 | 6.48 |
| PV UFCF | ||||||||||
| SUM PV UFCF | -500.6 | |||||||||
| Long Term Growth Rate, % | 2.00 | |||||||||
| Free cash flow (T + 1) | -119 | |||||||||
| Terminal Value | -2,661 | |||||||||
| Present Terminal Value | -1,944 | |||||||||
| Enterprise Value | -2,444 | |||||||||
| Net Debt | 1,021 | |||||||||
| Equity Value | -3,465 | |||||||||
| Diluted Shares Outstanding, MM | 18 | |||||||||
| Equity Value Per Share | -197.30 |
What You Will Get
- Real CPS Financials: Access to both historical and projected data for precise valuation.
- Customizable Inputs: Adjust WACC, tax rates, revenue growth, and capital expenditures as needed.
- Dynamic Calculations: Intrinsic value and NPV are computed automatically.
- Scenario Analysis: Explore various scenarios to assess Cooper-Standard's future performance.
- User-Friendly Design: Designed for industry professionals while remaining approachable for newcomers.
Key Features
- Comprehensive Financial Data: Gain access to precise pre-loaded historical figures and future forecasts for Cooper-Standard Holdings Inc. (CPS).
- Adjustable Forecast Parameters: Modify highlighted cells for key inputs such as WACC, growth rates, and profit margins.
- Real-Time Calculations: Automatic recalculations for DCF, Net Present Value (NPV), and cash flow assessments.
- User-Friendly Dashboard: Intuitive charts and summaries to help visualize your valuation outcomes.
- Designed for All Levels: A straightforward, user-friendly layout suitable for investors, CFOs, and consultants alike.
How It Works
- Step 1: Download the Excel file.
- Step 2: Review Cooper-Standard's pre-filled financial data and forecasts.
- Step 3: Modify key inputs such as revenue growth, WACC, and tax rates (highlighted cells).
- Step 4: Observe the DCF model update in real-time as you adjust your assumptions.
- Step 5: Analyze the outputs and leverage the results for your investment decisions.
Why Choose Cooper-Standard Holdings Inc. (CPS)?
- Industry Leader: Renowned for innovation and quality in the automotive sector.
- Robust Financial Performance: Consistent revenue growth and strong profitability metrics.
- Commitment to Sustainability: Focused on environmentally-friendly practices and products.
- Diverse Product Range: Offers a wide array of solutions for various automotive applications.
- Experienced Management: Led by a team with extensive industry expertise and vision.
Who Should Use This Product?
- Investors: Evaluate Cooper-Standard Holdings Inc.'s (CPS) market position before making investment decisions.
- CFOs and Financial Analysts: Enhance valuation methodologies and assess financial projections for Cooper-Standard Holdings Inc. (CPS).
- Startup Founders: Understand the valuation strategies of established companies like Cooper-Standard Holdings Inc. (CPS).
- Consultants: Create comprehensive valuation analyses and reports for clients focused on Cooper-Standard Holdings Inc. (CPS).
- Students and Educators: Utilize real-time data from Cooper-Standard Holdings Inc. (CPS) to teach and apply valuation practices.
What the Template Contains
- Operating and Balance Sheet Data: Pre-filled Cooper-Standard Holdings Inc. (CPS) historical data and forecasts, including revenue, EBITDA, EBIT, and capital expenditures.
- WACC Calculation: A dedicated sheet for Weighted Average Cost of Capital (WACC), including parameters like Beta, risk-free rate, and share price.
- DCF Valuation (Unlevered and Levered): Editable Discounted Cash Flow models showing intrinsic value with detailed calculations.
- Financial Statements: Pre-loaded financial statements (annual and quarterly) to support analysis.
- Key Ratios: Includes profitability, leverage, and efficiency ratios for Cooper-Standard Holdings Inc. (CPS).
- Dashboard and Charts: Visual summary of valuation outputs and assumptions to analyze results easily.
Disclaimer
All information, articles, and product details provided on this website are for general informational and educational purposes only. We do not claim any ownership over, nor do we intend to infringe upon, any trademarks, copyrights, logos, brand names, or other intellectual property mentioned or depicted on this site. Such intellectual property remains the property of its respective owners, and any references here are made solely for identification or informational purposes, without implying any affiliation, endorsement, or partnership.
We make no representations or warranties, express or implied, regarding the accuracy, completeness, or suitability of any content or products presented. Nothing on this website should be construed as legal, tax, investment, financial, medical, or other professional advice. In addition, no part of this site—including articles or product references—constitutes a solicitation, recommendation, endorsement, advertisement, or offer to buy or sell any securities, franchises, or other financial instruments, particularly in jurisdictions where such activity would be unlawful.
All content is of a general nature and may not address the specific circumstances of any individual or entity. It is not a substitute for professional advice or services. Any actions you take based on the information provided here are strictly at your own risk. You accept full responsibility for any decisions or outcomes arising from your use of this website and agree to release us from any liability in connection with your use of, or reliance upon, the content or products found herein.