
|
Carlisle Companies Incorporated (CSL) Avaliação DCF |
Totalmente Editável: Adapte-Se Às Suas Necessidades No Excel Ou Planilhas
Design Profissional: Modelos Confiáveis E Padrão Da Indústria
Pré-Construídos Para Uso Rápido E Eficiente
Compatível com MAC/PC, totalmente desbloqueado
Não É Necessária Experiência; Fácil De Seguir
Carlisle Companies Incorporated (CSL) Bundle
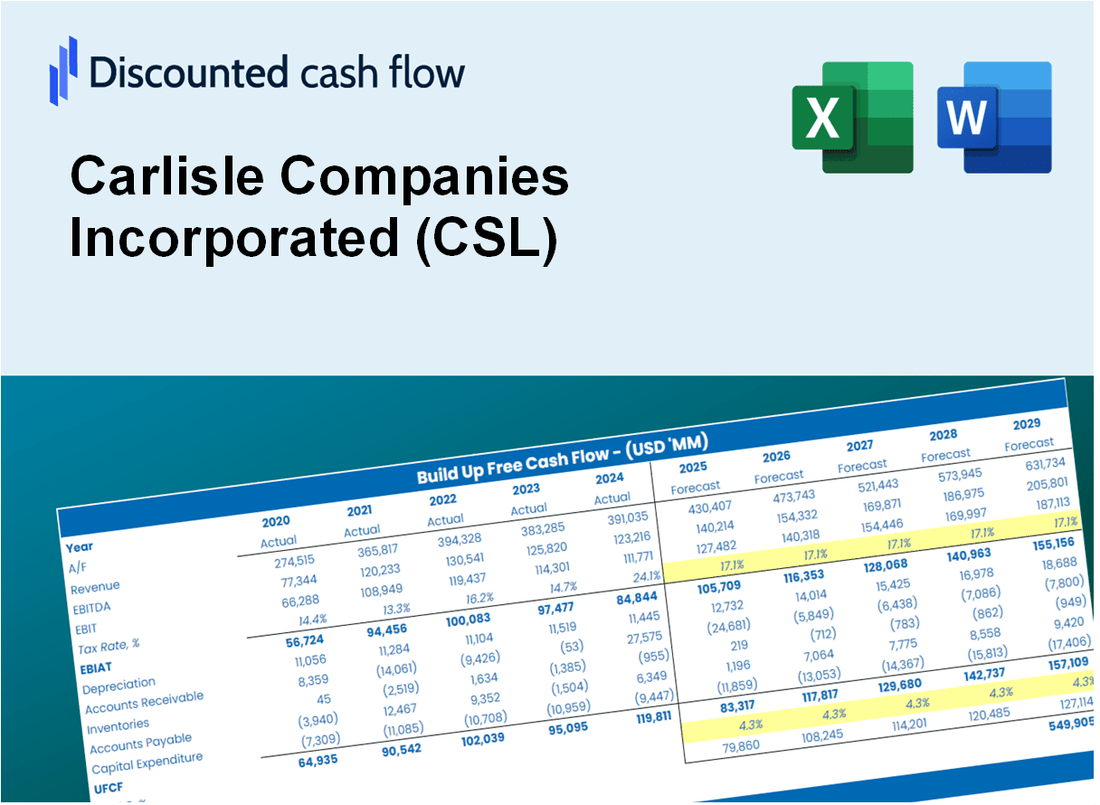
Ganhe domínio sobre suas empresas de avaliação da Carlisle Companies Incorporated (CSL) usando nossa sofisticada calculadora DCF! Este modelo do Excel é pré -carregado com dados CSL reais, permitindo que você ajuste as previsões e suposições para determinar com precisão o valor intrínseco das empresas Carlisle Incorporated.
Discounted Cash Flow (DCF) - (USD MM)
| Year | AY1 2020 |
AY2 2021 |
AY3 2022 |
AY4 2023 |
AY5 2024 |
FY1 2025 |
FY2 2026 |
FY3 2027 |
FY4 2028 |
FY5 2029 |
|---|---|---|---|---|---|---|---|---|---|---|
| Revenue | 3,969.9 | 3,836.7 | 5,449.4 | 4,586.9 | 5,003.6 | 5,403.1 | 5,834.5 | 6,300.3 | 6,803.3 | 7,346.4 |
| Revenue Growth, % | 0 | -3.36 | 42.03 | -15.83 | 9.08 | 7.98 | 7.98 | 7.98 | 7.98 | 7.98 |
| EBITDA | 705.0 | 796.3 | 1,460.9 | 1,210.7 | 1,356.8 | 1,284.1 | 1,386.7 | 1,497.4 | 1,616.9 | 1,746.0 |
| EBITDA, % | 17.76 | 20.75 | 26.81 | 26.39 | 27.12 | 23.77 | 23.77 | 23.77 | 23.77 | 23.77 |
| Depreciation | 224.2 | 226.2 | 251.3 | 204.7 | 172.6 | 260.1 | 280.8 | 303.3 | 327.5 | 353.6 |
| Depreciation, % | 5.65 | 5.9 | 4.61 | 4.46 | 3.45 | 4.81 | 4.81 | 4.81 | 4.81 | 4.81 |
| EBIT | 480.8 | 570.1 | 1,209.6 | 1,006.0 | 1,184.2 | 1,024.1 | 1,105.8 | 1,194.1 | 1,289.4 | 1,392.4 |
| EBIT, % | 12.11 | 14.86 | 22.2 | 21.93 | 23.67 | 18.95 | 18.95 | 18.95 | 18.95 | 18.95 |
| Total Cash | 897.1 | 324.4 | 364.8 | 576.7 | 753.5 | 706.5 | 762.9 | 823.8 | 889.6 | 960.6 |
| Total Cash, percent | .0 | .0 | .0 | .0 | .0 | .0 | .0 | .0 | .0 | .0 |
| Account Receivables | 638.9 | 886.7 | 615.3 | 615.3 | 579.7 | 815.8 | 881.0 | 951.3 | 1,027.2 | 1,109.2 |
| Account Receivables, % | 16.09 | 23.11 | 11.29 | 13.41 | 11.59 | 15.1 | 15.1 | 15.1 | 15.1 | 15.1 |
| Inventories | 432.7 | 605.1 | 518.0 | 361.7 | 472.7 | 578.2 | 624.4 | 674.2 | 728.1 | 786.2 |
| Inventories, % | 10.9 | 15.77 | 9.51 | 7.89 | 9.45 | 10.7 | 10.7 | 10.7 | 10.7 | 10.7 |
| Accounts Payable | 284.5 | 432.4 | 273.5 | 245.5 | 261.1 | 367.7 | 397.0 | 428.7 | 463.0 | 499.9 |
| Accounts Payable, % | 7.17 | 11.27 | 5.02 | 5.35 | 5.22 | 6.81 | 6.81 | 6.81 | 6.81 | 6.81 |
| Capital Expenditure | -95.5 | -134.8 | -183.5 | -142.2 | -113.3 | -158.3 | -171.0 | -184.6 | -199.3 | -215.3 |
| Capital Expenditure, % | -2.41 | -3.51 | -3.37 | -3.1 | -2.26 | -2.93 | -2.93 | -2.93 | -2.93 | -2.93 |
| Tax Rate, % | -18.08 | -18.08 | -18.08 | -18.08 | -18.08 | -18.08 | -18.08 | -18.08 | -18.08 | -18.08 |
| EBITAT | 380.8 | 490.7 | 994.6 | 829.8 | 1,398.4 | 880.7 | 951.0 | 1,026.9 | 1,108.9 | 1,197.4 |
| Depreciation | ||||||||||
| Changes in Account Receivables | ||||||||||
| Changes in Inventories | ||||||||||
| Changes in Accounts Payable | ||||||||||
| Capital Expenditure | ||||||||||
| UFCF | -277.6 | 309.8 | 1,262.0 | 1,020.6 | 1,397.9 | 747.3 | 978.9 | 1,057.0 | 1,141.4 | 1,232.6 |
| WACC, % | 7.6 | 7.63 | 7.62 | 7.62 | 7.7 | 7.63 | 7.63 | 7.63 | 7.63 | 7.63 |
| PV UFCF | ||||||||||
| SUM PV UFCF | 4,090.7 | |||||||||
| Long Term Growth Rate, % | 2.00 | |||||||||
| Free cash flow (T + 1) | 1,257 | |||||||||
| Terminal Value | 22,316 | |||||||||
| Present Terminal Value | 15,448 | |||||||||
| Enterprise Value | 19,539 | |||||||||
| Net Debt | 1,238 | |||||||||
| Equity Value | 18,301 | |||||||||
| Diluted Shares Outstanding, MM | 47 | |||||||||
| Equity Value Per Share | 388.56 |
What You Will Receive
- Adjustable Forecast Inputs: Effortlessly modify key assumptions (growth %, margins, WACC) to generate various scenarios.
- Comprehensive Financial Data: Carlisle Companies Incorporated’s (CSL) financial data pre-loaded to facilitate your analysis.
- Instant DCF Calculations: The template automatically computes Net Present Value (NPV) and intrinsic value for you.
- Tailored and Professional Design: A refined Excel model that can be customized to meet your valuation requirements.
- Designed for Analysts and Investors: Perfect for evaluating projections, confirming strategies, and enhancing efficiency.
Key Features
- 🔍 Real-Life CSL Financials: Pre-filled historical and projected data for Carlisle Companies Incorporated (CSL).
- ✏️ Fully Customizable Inputs: Adjust all critical parameters (yellow cells) like WACC, growth %, and tax rates.
- 📊 Professional DCF Valuation: Built-in formulas calculate Carlisle’s intrinsic value using the Discounted Cash Flow method.
- ⚡ Instant Results: Visualize Carlisle’s valuation instantly after making changes.
- Scenario Analysis: Test and compare outcomes for various financial assumptions side-by-side.
How It Works
- Step 1: Download the prebuilt Excel template featuring Carlisle Companies Incorporated’s (CSL) data.
- Step 2: Navigate through the pre-filled sheets to familiarize yourself with the essential metrics.
- Step 3: Modify forecasts and assumptions in the editable yellow cells (WACC, growth, margins).
- Step 4: Instantly see the updated results, including the intrinsic value of Carlisle Companies Incorporated (CSL).
- Step 5: Use the outputs to make informed investment decisions or create detailed reports.
Why Choose This Calculator for Carlisle Companies Incorporated (CSL)?
- Comprehensive Tool: Features DCF, WACC, and financial ratio analyses all in one convenient package.
- Customizable Inputs: Modify the yellow-highlighted cells to explore different financial scenarios.
- Detailed Insights: Automatically computes Carlisle's intrinsic value and Net Present Value.
- Preloaded Data: Historical and projected data provide reliable starting points for analysis.
- Professional Quality: Perfect for financial analysts, investors, and business consultants.
Who Should Use This Product?
- Finance Students: Master valuation techniques and apply them to real-world data for Carlisle Companies Incorporated (CSL).
- Academics: Integrate industry-standard models into your research or educational programs.
- Investors: Validate your investment strategies by analyzing valuation metrics for Carlisle Companies Incorporated (CSL).
- Analysts: Enhance your analysis with a customizable DCF model tailored for Carlisle Companies Incorporated (CSL).
- Small Business Owners: Understand the valuation methods used for large public firms like Carlisle Companies Incorporated (CSL).
What the Template Contains
- Pre-Filled Data: Includes Carlisle Companies Incorporated’s (CSL) historical financials and forecasts.
- Discounted Cash Flow Model: Editable DCF valuation model with automatic calculations.
- Weighted Average Cost of Capital (WACC): A dedicated sheet for calculating WACC based on custom inputs.
- Key Financial Ratios: Analyze Carlisle’s (CSL) profitability, efficiency, and leverage.
- Customizable Inputs: Edit revenue growth, margins, and tax rates with ease.
- Clear Dashboard: Charts and tables summarizing key valuation results.
Disclaimer
All information, articles, and product details provided on this website are for general informational and educational purposes only. We do not claim any ownership over, nor do we intend to infringe upon, any trademarks, copyrights, logos, brand names, or other intellectual property mentioned or depicted on this site. Such intellectual property remains the property of its respective owners, and any references here are made solely for identification or informational purposes, without implying any affiliation, endorsement, or partnership.
We make no representations or warranties, express or implied, regarding the accuracy, completeness, or suitability of any content or products presented. Nothing on this website should be construed as legal, tax, investment, financial, medical, or other professional advice. In addition, no part of this site—including articles or product references—constitutes a solicitation, recommendation, endorsement, advertisement, or offer to buy or sell any securities, franchises, or other financial instruments, particularly in jurisdictions where such activity would be unlawful.
All content is of a general nature and may not address the specific circumstances of any individual or entity. It is not a substitute for professional advice or services. Any actions you take based on the information provided here are strictly at your own risk. You accept full responsibility for any decisions or outcomes arising from your use of this website and agree to release us from any liability in connection with your use of, or reliance upon, the content or products found herein.