
|
Charles & Colvard, Ltd. (CTH) Avaliação DCF |
Totalmente Editável: Adapte-Se Às Suas Necessidades No Excel Ou Planilhas
Design Profissional: Modelos Confiáveis E Padrão Da Indústria
Pré-Construídos Para Uso Rápido E Eficiente
Compatível com MAC/PC, totalmente desbloqueado
Não É Necessária Experiência; Fácil De Seguir
Charles & Colvard, Ltd. (CTHR) Bundle
Avalie Charles & As perspectivas financeiras da Colvard, Ltd. como um especialista! Esta calculadora DCF (CTH) fornece dados financeiros pré-preenchidos e flexibilidade completa para modificar o crescimento da receita, o WACC, as margens e outras suposições essenciais para se alinhar às suas previsões.
What You Will Get
- Real CTHR Financial Data: Pre-filled with Charles & Colvard’s historical and projected data for precise analysis.
- Fully Editable Template: Modify key inputs like revenue growth, WACC, and EBITDA % with ease.
- Automatic Calculations: See Charles & Colvard’s intrinsic value update instantly based on your changes.
- Professional Valuation Tool: Designed for investors, analysts, and consultants seeking accurate DCF results.
- User-Friendly Design: Simple structure and clear instructions for all experience levels.
Key Features
- Accurate Financial Data: Gain access to reliable pre-loaded historical figures and future forecasts for Charles & Colvard, Ltd. (CTHR).
- Adjustable Forecast Inputs: Modify highlighted cells for parameters such as WACC, growth rates, and profit margins.
- Real-Time Calculations: Enjoy automatic updates for DCF, Net Present Value (NPV), and cash flow assessments.
- Interactive Dashboard: User-friendly charts and summaries to help you visualize your valuation outcomes.
- Designed for All Users: An intuitive layout tailored for investors, CFOs, and consultants, regardless of experience level.
How It Works
- Step 1: Download the prebuilt Excel template with Charles & Colvard's (CTHR) data included.
- Step 2: Explore the pre-filled sheets and familiarize yourself with the key metrics.
- Step 3: Update forecasts and assumptions in the editable yellow cells (WACC, growth, margins).
- Step 4: Instantly view recalculated results, including Charles & Colvard's (CTHR) intrinsic value.
- Step 5: Make informed investment decisions or generate reports using the outputs.
Why Choose Charles & Colvard's Calculator?
- All-in-One Solution: Features DCF, WACC, and financial ratio analyses tailored for CTHR.
- Flexible Inputs: Modify the highlighted cells to explore different investment scenarios.
- In-Depth Analysis: Automatically computes Charles & Colvard’s intrinsic value and Net Present Value.
- Preloaded Information: Access to historical and projected data for reliable analysis.
- Expert-Level Tool: Perfect for financial analysts, investors, and business advisors focusing on CTHR.
Who Should Use This Product?
- Jewelry Designers: Explore innovative techniques and utilize real market data for your creations.
- Academics: Integrate industry models into your courses or research projects.
- Investors: Evaluate your investment strategies and analyze the market performance of Charles & Colvard, Ltd. (CTHR).
- Market Analysts: Enhance your analysis with a customizable model tailored for the jewelry industry.
- Retail Business Owners: Discover how major companies like Charles & Colvard, Ltd. (CTHR) approach market analysis.
What the Template Contains
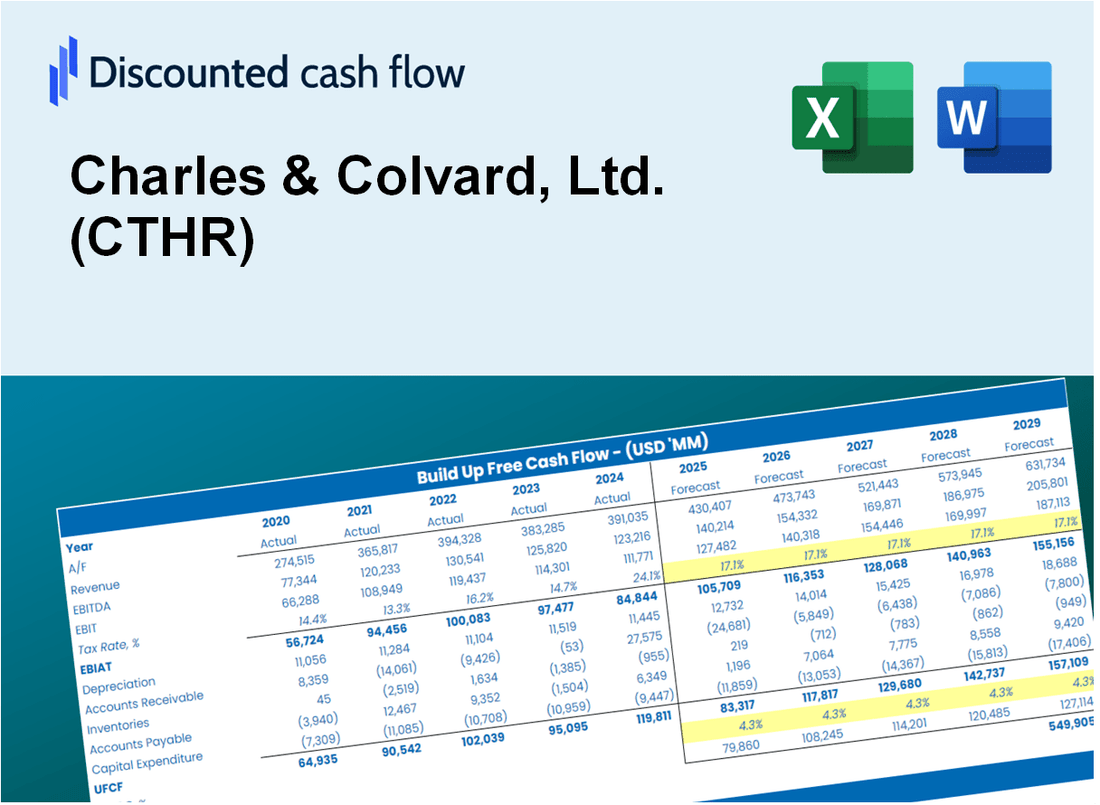
- Operating and Balance Sheet Data: Pre-filled Charles & Colvard historical data and forecasts, including revenue, EBITDA, EBIT, and capital expenditures.
- WACC Calculation: A dedicated sheet for Weighted Average Cost of Capital (WACC), including parameters like Beta, risk-free rate, and share price.
- DCF Valuation (Unlevered and Levered): Editable Discounted Cash Flow models showing intrinsic value with detailed calculations.
- Financial Statements: Pre-loaded financial statements (annual and quarterly) to support analysis.
- Key Ratios: Includes profitability, leverage, and efficiency ratios for Charles & Colvard, Ltd. (CTHR).
- Dashboard and Charts: Visual summary of valuation outputs and assumptions to analyze results easily.
Disclaimer
All information, articles, and product details provided on this website are for general informational and educational purposes only. We do not claim any ownership over, nor do we intend to infringe upon, any trademarks, copyrights, logos, brand names, or other intellectual property mentioned or depicted on this site. Such intellectual property remains the property of its respective owners, and any references here are made solely for identification or informational purposes, without implying any affiliation, endorsement, or partnership.
We make no representations or warranties, express or implied, regarding the accuracy, completeness, or suitability of any content or products presented. Nothing on this website should be construed as legal, tax, investment, financial, medical, or other professional advice. In addition, no part of this site—including articles or product references—constitutes a solicitation, recommendation, endorsement, advertisement, or offer to buy or sell any securities, franchises, or other financial instruments, particularly in jurisdictions where such activity would be unlawful.
All content is of a general nature and may not address the specific circumstances of any individual or entity. It is not a substitute for professional advice or services. Any actions you take based on the information provided here are strictly at your own risk. You accept full responsibility for any decisions or outcomes arising from your use of this website and agree to release us from any liability in connection with your use of, or reliance upon, the content or products found herein.