
|
Cantalupe, Inc. (CTLP) Avaliação DCF |
Totalmente Editável: Adapte-Se Às Suas Necessidades No Excel Ou Planilhas
Design Profissional: Modelos Confiáveis E Padrão Da Indústria
Pré-Construídos Para Uso Rápido E Eficiente
Compatível com MAC/PC, totalmente desbloqueado
Não É Necessária Experiência; Fácil De Seguir
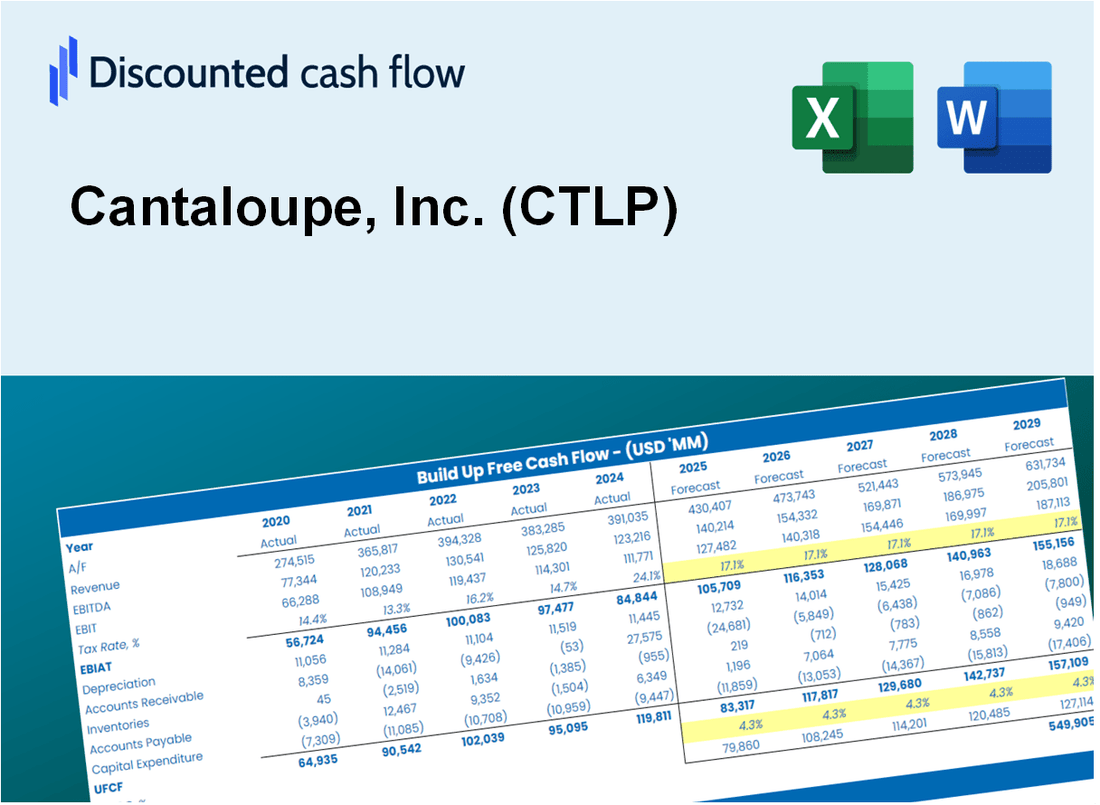
Cantaloupe, Inc. (CTLP) Bundle
Aprimore suas opções de investimento com a calculadora DCF Cantaloupe, Inc. (CTLP)! Obtenha dados financeiros reais para melão, ajuste as projeções e despesas de crescimento e visualize instantaneamente como essas alterações afetam o valor intrínseco da Cantaloupe, Inc. (CTLP).
Discounted Cash Flow (DCF) - (USD MM)
| Year | AY1 2021 |
AY2 2022 |
AY3 2023 |
AY4 2024 |
AY5 2025 |
FY1 2026 |
FY2 2027 |
FY3 2028 |
FY4 2029 |
FY5 2030 |
|---|---|---|---|---|---|---|---|---|---|---|
| Revenue | 166.9 | 205.2 | 243.6 | 268.6 | 302.5 | 351.4 | 408.0 | 473.9 | 550.3 | 639.1 |
| Revenue Growth, % | 0 | 22.92 | 18.73 | 10.24 | 12.64 | 16.13 | 16.13 | 16.13 | 16.13 | 16.13 |
| EBITDA | 1.2 | 4.3 | 11.9 | 28.1 | 42.8 | 22.7 | 26.4 | 30.6 | 35.6 | 41.3 |
| EBITDA, % | 0.71284 | 2.11 | 4.9 | 10.47 | 14.13 | 6.47 | 6.47 | 6.47 | 6.47 | 6.47 |
| Depreciation | 5.5 | 5.3 | 8.8 | 12.2 | 17.8 | 14.0 | 16.3 | 18.9 | 21.9 | 25.5 |
| Depreciation, % | 3.3 | 2.6 | 3.61 | 4.54 | 5.88 | 3.99 | 3.99 | 3.99 | 3.99 | 3.99 |
| EBIT | -4.3 | -1.0 | 3.1 | 15.9 | 25.0 | 8.7 | 10.1 | 11.7 | 13.6 | 15.8 |
| EBIT, % | -2.59 | -0.48391 | 1.29 | 5.92 | 8.25 | 2.48 | 2.48 | 2.48 | 2.48 | 2.48 |
| Total Cash | 88.1 | 68.1 | 50.9 | 58.9 | 51.1 | 102.4 | 118.9 | 138.1 | 160.4 | 186.3 |
| Total Cash, percent | .0 | .0 | .0 | .0 | .0 | .0 | .0 | .0 | .0 | .0 |
| Account Receivables | 35.4 | 44.4 | 36.8 | 50.2 | 43.3 | 64.0 | 74.3 | 86.3 | 100.2 | 116.3 |
| Account Receivables, % | 21.23 | 21.65 | 15.12 | 18.7 | 14.33 | 18.2 | 18.2 | 18.2 | 18.2 | 18.2 |
| Inventories | 5.3 | 19.8 | 31.9 | 40.8 | 45.7 | 39.5 | 45.8 | 53.2 | 61.8 | 71.8 |
| Inventories, % | 3.17 | 9.63 | 13.08 | 15.19 | 15.11 | 11.23 | 11.23 | 11.23 | 11.23 | 11.23 |
| Accounts Payable | 36.8 | 48.4 | 52.9 | 78.9 | 58.7 | 81.6 | 94.8 | 110.1 | 127.8 | 148.4 |
| Accounts Payable, % | 22.03 | 23.61 | 21.7 | 29.37 | 19.42 | 23.22 | 23.22 | 23.22 | 23.22 | 23.22 |
| Capital Expenditure | -1.8 | -9.3 | -16.2 | -14.9 | -17.0 | -16.5 | -19.1 | -22.2 | -25.8 | -29.9 |
| Capital Expenditure, % | -1.1 | -4.51 | -6.63 | -5.56 | -5.62 | -4.68 | -4.68 | -4.68 | -4.68 | -4.68 |
| Tax Rate, % | -190.94 | -190.94 | -190.94 | -190.94 | -190.94 | -190.94 | -190.94 | -190.94 | -190.94 | -190.94 |
| EBITAT | -4.5 | -1.1 | 2.4 | 14.7 | 72.6 | 8.2 | 9.5 | 11.0 | 12.8 | 14.9 |
| Depreciation | ||||||||||
| Changes in Account Receivables | ||||||||||
| Changes in Inventories | ||||||||||
| Changes in Accounts Payable | ||||||||||
| Capital Expenditure | ||||||||||
| UFCF | -4.8 | -16.8 | -5.0 | 15.7 | 55.2 | 14.2 | 3.1 | 3.6 | 4.2 | 4.9 |
| WACC, % | 8.94 | 8.94 | 8.87 | 8.91 | 8.94 | 8.92 | 8.92 | 8.92 | 8.92 | 8.92 |
| PV UFCF | ||||||||||
| SUM PV UFCF | 24.7 | |||||||||
| Long Term Growth Rate, % | 2.00 | |||||||||
| Free cash flow (T + 1) | 5 | |||||||||
| Terminal Value | 72 | |||||||||
| Present Terminal Value | 47 | |||||||||
| Enterprise Value | 72 | |||||||||
| Net Debt | -3 | |||||||||
| Equity Value | 75 | |||||||||
| Diluted Shares Outstanding, MM | 75 | |||||||||
| Equity Value Per Share | 1.00 |
What You Will Get
- Real CTLP Financial Data: Pre-filled with Cantaloupe, Inc.'s historical and projected data for precise analysis.
- Fully Editable Template: Modify key inputs like revenue growth, WACC, and EBITDA % with ease.
- Automatic Calculations: See Cantaloupe, Inc.'s intrinsic value update instantly based on your changes.
- Professional Valuation Tool: Designed for investors, analysts, and consultants seeking accurate DCF results.
- User-Friendly Design: Simple structure and clear instructions for all experience levels.
Key Features
- 🔍 Real-Life CTLP Financials: Pre-filled historical and projected data for Cantaloupe, Inc. (CTLP).
- ✏️ Fully Customizable Inputs: Adjust all critical parameters (yellow cells) like WACC, growth %, and tax rates.
- 📊 Professional DCF Valuation: Built-in formulas calculate Cantaloupe’s intrinsic value using the Discounted Cash Flow method.
- ⚡ Instant Results: Visualize Cantaloupe’s valuation instantly after making changes.
- Scenario Analysis: Test and compare outcomes for various financial assumptions side-by-side.
How It Works
- Download: Obtain the pre-formatted Excel file containing Cantaloupe, Inc.'s (CTLP) financial data.
- Customize: Modify forecasts such as revenue growth, EBITDA %, and WACC to fit your analysis.
- Update Automatically: The intrinsic value and NPV calculations refresh in real-time as you make changes.
- Test Scenarios: Develop various projections and instantly compare the results.
- Make Decisions: Utilize the valuation findings to inform your investment choices.
Why Choose Cantaloupe, Inc. (CTLP)?
- Innovative Solutions: Cutting-edge technology designed to enhance operational efficiency.
- Data-Driven Insights: Leverage analytics to make informed business decisions.
- Seamless Integration: Easily incorporate our services into your existing systems.
- User-Friendly Interface: Intuitive design ensures a smooth user experience for all levels.
- Industry-Leading Support: Our team of experts is available to assist you whenever needed.
Who Should Use Cantaloupe, Inc. (CTLP)?
- Investors: Enhance your investment strategies with insights from a leading provider in the market.
- Financial Analysts: Utilize comprehensive data analytics to streamline your financial assessments.
- Consultants: Tailor solutions quickly for client projects leveraging Cantaloupe’s robust offerings.
- Tech Enthusiasts: Explore innovative technologies that drive efficiency in the vending and retail industries.
- Educators and Students: Incorporate real-life case studies into your curriculum to enrich learning experiences.
What the Template Contains
- Preloaded CTLP Data: Historical and projected financial data, including revenue, EBIT, and capital expenditures.
- DCF and WACC Models: Professional-grade sheets for calculating intrinsic value and Weighted Average Cost of Capital.
- Editable Inputs: Yellow-highlighted cells for adjusting revenue growth, tax rates, and discount rates.
- Financial Statements: Comprehensive annual and quarterly financials for deeper analysis.
- Key Ratios: Profitability, leverage, and efficiency ratios to evaluate performance.
- Dashboard and Charts: Visual summaries of valuation outcomes and assumptions.
Disclaimer
All information, articles, and product details provided on this website are for general informational and educational purposes only. We do not claim any ownership over, nor do we intend to infringe upon, any trademarks, copyrights, logos, brand names, or other intellectual property mentioned or depicted on this site. Such intellectual property remains the property of its respective owners, and any references here are made solely for identification or informational purposes, without implying any affiliation, endorsement, or partnership.
We make no representations or warranties, express or implied, regarding the accuracy, completeness, or suitability of any content or products presented. Nothing on this website should be construed as legal, tax, investment, financial, medical, or other professional advice. In addition, no part of this site—including articles or product references—constitutes a solicitation, recommendation, endorsement, advertisement, or offer to buy or sell any securities, franchises, or other financial instruments, particularly in jurisdictions where such activity would be unlawful.
All content is of a general nature and may not address the specific circumstances of any individual or entity. It is not a substitute for professional advice or services. Any actions you take based on the information provided here are strictly at your own risk. You accept full responsibility for any decisions or outcomes arising from your use of this website and agree to release us from any liability in connection with your use of, or reliance upon, the content or products found herein.