
|
Avaliação DCF de Castor Maritime Inc. (CTRM) |
Totalmente Editável: Adapte-Se Às Suas Necessidades No Excel Ou Planilhas
Design Profissional: Modelos Confiáveis E Padrão Da Indústria
Pré-Construídos Para Uso Rápido E Eficiente
Compatível com MAC/PC, totalmente desbloqueado
Não É Necessária Experiência; Fácil De Seguir
Castor Maritime Inc. (CTRM) Bundle
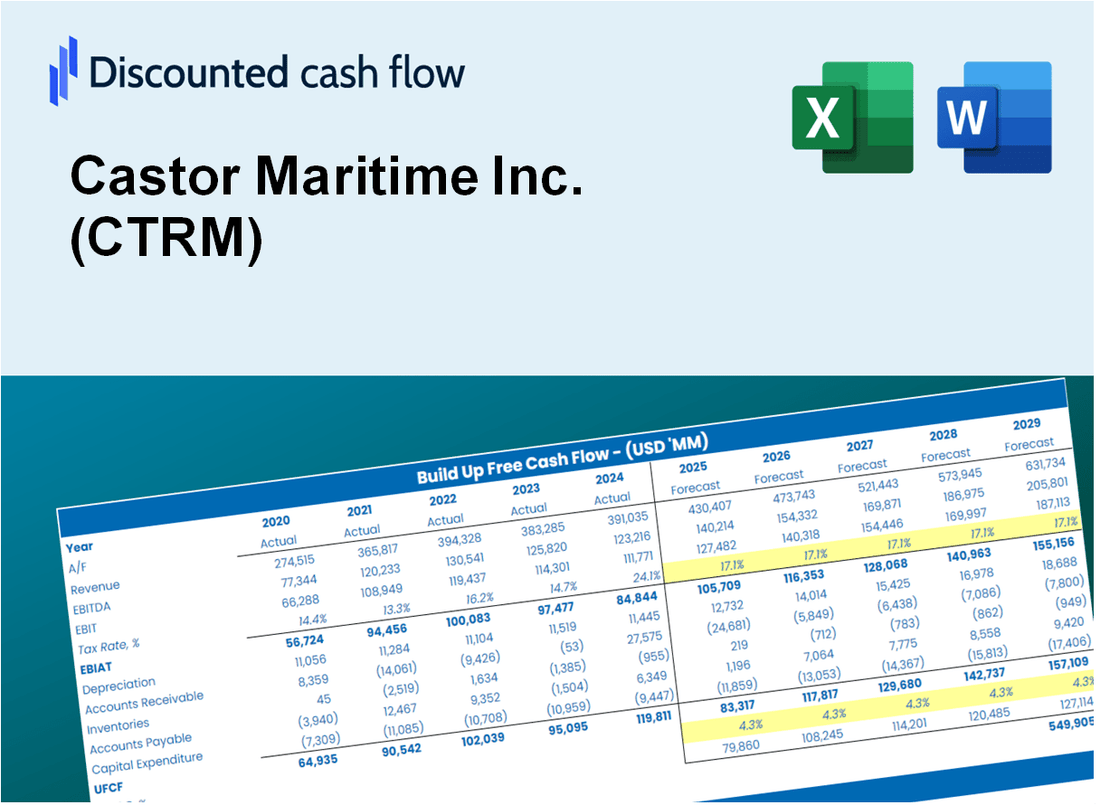
Simplifique a avaliação de Castor Maritime Inc. (CTRM) com esta calculadora DCF personalizável! Apresentando o Real Castor Maritime Inc. (CTRM) financeiras e insumos de previsão ajustáveis, você pode testar cenários e descobrir o valor justo da Castor Maritime Inc. (CTRM) em minutos.
Discounted Cash Flow (DCF) - (USD MM)
| Year | AY1 2020 |
AY2 2021 |
AY3 2022 |
AY4 2023 |
AY5 2024 |
FY1 2025 |
FY2 2026 |
FY3 2027 |
FY4 2028 |
FY5 2029 |
|---|---|---|---|---|---|---|---|---|---|---|
| Revenue | 12.5 | 132.0 | 150.2 | 97.5 | 66.2 | 74.0 | 82.6 | 92.2 | 102.9 | 114.9 |
| Revenue Growth, % | 0 | 957.44 | 13.76 | -35.08 | -32.07 | 11.65 | 11.65 | 11.65 | 11.65 | 11.65 |
| EBITDA | 2.4 | 70.0 | 92.3 | 55.7 | 37.4 | 36.5 | 40.8 | 45.5 | 50.8 | 56.8 |
| EBITDA, % | 18.92 | 53 | 61.43 | 57.13 | 56.42 | 49.38 | 49.38 | 49.38 | 49.38 | 49.38 |
| Depreciation | 1.9 | 14.4 | 18.5 | 23.0 | 15.8 | 12.7 | 14.2 | 15.8 | 17.7 | 19.8 |
| Depreciation, % | 15.25 | 10.88 | 12.34 | 23.55 | 23.92 | 17.19 | 17.19 | 17.19 | 17.19 | 17.19 |
| EBIT | .5 | 55.6 | 73.7 | 32.7 | 21.5 | 23.8 | 26.6 | 29.7 | 33.1 | 37.0 |
| EBIT, % | 3.67 | 42.12 | 49.09 | 33.57 | 32.49 | 32.19 | 32.19 | 32.19 | 32.19 | 32.19 |
| Total Cash | 8.9 | 37.2 | 100.6 | 188.5 | 157.0 | 54.2 | 60.5 | 67.6 | 75.5 | 84.3 |
| Total Cash, percent | .0 | .0 | .0 | .0 | .0 | .0 | .0 | .0 | .0 | .0 |
| Account Receivables | 2.9 | 8.2 | 5.4 | 8.6 | 21.0 | 10.8 | 12.1 | 13.5 | 15.1 | 16.8 |
| Account Receivables, % | 22.91 | 6.23 | 3.58 | 8.78 | 31.67 | 14.63 | 14.63 | 14.63 | 14.63 | 14.63 |
| Inventories | .7 | 4.4 | 1.9 | 1.0 | 1.6 | 2.0 | 2.3 | 2.5 | 2.8 | 3.2 |
| Inventories, % | 5.72 | 3.36 | 1.29 | 1 | 2.34 | 2.74 | 2.74 | 2.74 | 2.74 | 2.74 |
| Accounts Payable | 2.1 | 5.0 | 7.8 | 2.8 | 2.1 | 4.7 | 5.3 | 5.9 | 6.5 | 7.3 |
| Accounts Payable, % | 16.65 | 3.82 | 5.21 | 2.91 | 3.21 | 6.36 | 6.36 | 6.36 | 6.36 | 6.36 |
| Capital Expenditure | -35.5 | -348.6 | -76.4 | -.6 | -72.2 | -52.0 | -58.1 | -64.8 | -72.4 | -80.8 |
| Capital Expenditure, % | -284.06 | -264.02 | -50.86 | -0.63916 | -108.95 | -70.3 | -70.3 | -70.3 | -70.3 | -70.3 |
| Tax Rate, % | 5.31 | 5.31 | 5.31 | 5.31 | 5.31 | 5.31 | 5.31 | 5.31 | 5.31 | 5.31 |
| EBITAT | .5 | 54.8 | 130.6 | 58.9 | 20.4 | 23.5 | 26.2 | 29.3 | 32.7 | 36.5 |
| Depreciation | ||||||||||
| Changes in Account Receivables | ||||||||||
| Changes in Inventories | ||||||||||
| Changes in Accounts Payable | ||||||||||
| Capital Expenditure | ||||||||||
| UFCF | -34.6 | -285.6 | 80.9 | 74.0 | -49.6 | -3.5 | -18.6 | -20.8 | -23.2 | -25.9 |
| WACC, % | 5.96 | 5.9 | 5.96 | 5.96 | 5.78 | 5.91 | 5.91 | 5.91 | 5.91 | 5.91 |
| PV UFCF | ||||||||||
| SUM PV UFCF | -75.2 | |||||||||
| Long Term Growth Rate, % | 2.00 | |||||||||
| Free cash flow (T + 1) | -26 | |||||||||
| Terminal Value | -675 | |||||||||
| Present Terminal Value | -507 | |||||||||
| Enterprise Value | -582 | |||||||||
| Net Debt | 23 | |||||||||
| Equity Value | -605 | |||||||||
| Diluted Shares Outstanding, MM | 39 | |||||||||
| Equity Value Per Share | -15.62 |
What You Will Get
- Real CTRM Financial Data: Pre-filled with Castor Maritime Inc.’s historical and projected data for precise analysis.
- Fully Editable Template: Modify key inputs like revenue growth, WACC, and EBITDA % with ease.
- Automatic Calculations: See Castor Maritime Inc.’s intrinsic value update instantly based on your changes.
- Professional Valuation Tool: Designed for investors, analysts, and consultants seeking accurate DCF results.
- User-Friendly Design: Simple structure and clear instructions for all experience levels.
Key Features
- Customizable Forecast Inputs: Adjust essential metrics such as fleet growth, operating costs, and capital investments.
- Instant DCF Valuation: Quickly computes intrinsic value, NPV, and additional financial metrics.
- High-Precision Accuracy: Leverages Castor Maritime Inc.'s (CTRM) actual financial data for dependable valuation results.
- Effortless Scenario Analysis: Evaluate various assumptions and analyze results with ease.
- Efficiency Booster: Avoid the complexities of constructing intricate valuation models from the ground up.
How It Works
- 1. Access the Template: Download and open the Excel file containing Castor Maritime Inc.'s (CTRM) preloaded data.
- 2. Adjust Assumptions: Modify key variables such as growth rates, WACC, and capital expenditures.
- 3. Analyze Results Instantly: The DCF model automatically computes intrinsic value and NPV.
- 4. Explore Scenarios: Evaluate multiple forecasts to investigate various valuation outcomes.
- 5. Present with Assurance: Share professional valuation insights to bolster your decision-making process.
Why Choose This Calculator for Castor Maritime Inc. (CTRM)?
- Comprehensive Tool: Integrates DCF, WACC, and financial ratio analyses tailored for Castor Maritime Inc. (CTRM).
- Customizable Inputs: Modify yellow-highlighted cells to explore different financial scenarios for Castor Maritime Inc. (CTRM).
- Detailed Insights: Automatically computes the intrinsic value and Net Present Value for Castor Maritime Inc. (CTRM).
- Preloaded Data: Historical and projected data provide reliable benchmarks for Castor Maritime Inc. (CTRM).
- Professional Quality: Perfect for financial analysts, investors, and business consultants focusing on Castor Maritime Inc. (CTRM).
Who Should Use This Product?
- Finance Students: Explore maritime industry valuation techniques and apply them using real data.
- Academics: Integrate professional models into your research or teaching focused on maritime finance.
- Investors: Evaluate your own assumptions and analyze valuation outcomes for Castor Maritime Inc. (CTRM) stock.
- Analysts: Enhance your analysis with a pre-built, customizable DCF model tailored for maritime companies.
- Small Business Owners: Understand how larger maritime firms like Castor Maritime Inc. (CTRM) are assessed in the market.
What the Template Contains
- Historical Data: Includes Castor Maritime Inc.'s (CTRM) past financial performance and baseline forecasts.
- DCF and Levered DCF Models: Comprehensive templates designed to assess the intrinsic value of Castor Maritime Inc. (CTRM).
- WACC Sheet: Pre-configured calculations for Weighted Average Cost of Capital specific to Castor Maritime Inc. (CTRM).
- Editable Inputs: Adjust key drivers such as growth rates, EBITDA %, and CAPEX assumptions for Castor Maritime Inc. (CTRM).
- Quarterly and Annual Statements: A thorough analysis of Castor Maritime Inc.'s (CTRM) financial statements.
- Interactive Dashboard: Dynamically visualize valuation results and projections for Castor Maritime Inc. (CTRM).
Disclaimer
All information, articles, and product details provided on this website are for general informational and educational purposes only. We do not claim any ownership over, nor do we intend to infringe upon, any trademarks, copyrights, logos, brand names, or other intellectual property mentioned or depicted on this site. Such intellectual property remains the property of its respective owners, and any references here are made solely for identification or informational purposes, without implying any affiliation, endorsement, or partnership.
We make no representations or warranties, express or implied, regarding the accuracy, completeness, or suitability of any content or products presented. Nothing on this website should be construed as legal, tax, investment, financial, medical, or other professional advice. In addition, no part of this site—including articles or product references—constitutes a solicitation, recommendation, endorsement, advertisement, or offer to buy or sell any securities, franchises, or other financial instruments, particularly in jurisdictions where such activity would be unlawful.
All content is of a general nature and may not address the specific circumstances of any individual or entity. It is not a substitute for professional advice or services. Any actions you take based on the information provided here are strictly at your own risk. You accept full responsibility for any decisions or outcomes arising from your use of this website and agree to release us from any liability in connection with your use of, or reliance upon, the content or products found herein.