
|
Currys plc (cury.l) avaliação dcf |
Totalmente Editável: Adapte-Se Às Suas Necessidades No Excel Ou Planilhas
Design Profissional: Modelos Confiáveis E Padrão Da Indústria
Pré-Construídos Para Uso Rápido E Eficiente
Compatível com MAC/PC, totalmente desbloqueado
Não É Necessária Experiência; Fácil De Seguir
Currys plc (CURY.L) Bundle
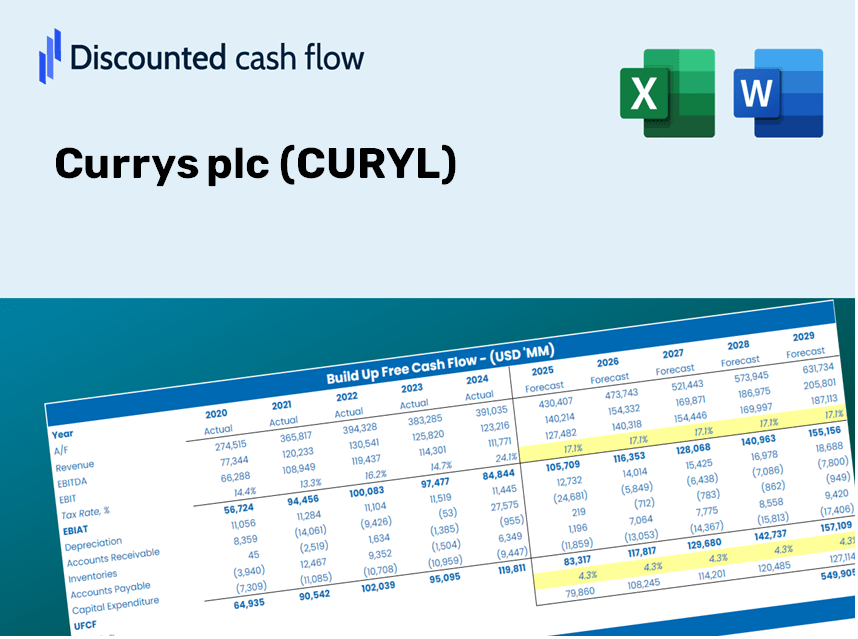
Projetado para precisão, nossa calculadora DCF (curil) permite avaliar a avaliação do Currys PLC usando dados financeiros do mundo real, oferecendo completa flexibilidade para modificar todos os parâmetros essenciais para melhorar as projeções.
Discounted Cash Flow (DCF) - (USD MM)
| Year | AY1 2021 |
AY2 2022 |
AY3 2023 |
AY4 2024 |
AY5 2025 |
FY1 2026 |
FY2 2027 |
FY3 2028 |
FY4 2029 |
FY5 2030 |
|---|---|---|---|---|---|---|---|---|---|---|
| Revenue | 10,344.0 | 10,144.0 | 9,511.0 | 8,476.0 | 8,706.0 | 8,350.3 | 8,009.2 | 7,681.9 | 7,368.1 | 7,067.1 |
| Revenue Growth, % | 0 | -1.93 | -6.24 | -10.88 | 2.71 | -4.09 | -4.09 | -4.09 | -4.09 | -4.09 |
| EBITDA | 504.0 | 560.0 | -56.0 | 421.0 | 494.0 | 341.4 | 327.5 | 314.1 | 301.3 | 289.0 |
| EBITDA, % | 4.87 | 5.52 | -0.58879 | 4.97 | 5.67 | 4.09 | 4.09 | 4.09 | 4.09 | 4.09 |
| Depreciation | 362.0 | 338.0 | 308.0 | 299.0 | 289.0 | 282.5 | 271.0 | 259.9 | 249.3 | 239.1 |
| Depreciation, % | 3.5 | 3.33 | 3.24 | 3.53 | 3.32 | 3.38 | 3.38 | 3.38 | 3.38 | 3.38 |
| EBIT | 142.0 | 222.0 | -364.0 | 122.0 | 205.0 | 58.9 | 56.5 | 54.2 | 52.0 | 49.9 |
| EBIT, % | 1.37 | 2.19 | -3.83 | 1.44 | 2.35 | 0.70563 | 0.70563 | 0.70563 | 0.70563 | 0.70563 |
| Total Cash | 175.0 | 126.0 | 97.0 | 125.0 | 179.0 | 125.0 | 119.9 | 115.0 | 110.3 | 105.8 |
| Total Cash, percent | .0 | .0 | .0 | .0 | .0 | .0 | .0 | .0 | .0 | .0 |
| Account Receivables | 588.0 | 697.0 | 632.0 | 617.0 | 685.0 | 573.6 | 550.2 | 527.7 | 506.2 | 485.5 |
| Account Receivables, % | 5.68 | 6.87 | 6.64 | 7.28 | 7.87 | 6.87 | 6.87 | 6.87 | 6.87 | 6.87 |
| Inventories | 1,178.0 | 1,286.0 | 1,151.0 | 1,034.0 | 1,037.0 | 1,006.7 | 965.6 | 926.1 | 888.3 | 852.0 |
| Inventories, % | 11.39 | 12.68 | 12.1 | 12.2 | 11.91 | 12.06 | 12.06 | 12.06 | 12.06 | 12.06 |
| Accounts Payable | 1,420.0 | 1,614.0 | 1,439.0 | 1,167.0 | 1,170.0 | 1,202.0 | 1,152.9 | 1,105.8 | 1,060.6 | 1,017.3 |
| Accounts Payable, % | 13.73 | 15.91 | 15.13 | 13.77 | 13.44 | 14.4 | 14.4 | 14.4 | 14.4 | 14.4 |
| Capital Expenditure | -122.0 | -133.0 | -111.0 | -48.0 | -77.0 | -85.3 | -81.8 | -78.5 | -75.3 | -72.2 |
| Capital Expenditure, % | -1.18 | -1.31 | -1.17 | -0.5663 | -0.88445 | -1.02 | -1.02 | -1.02 | -1.02 | -1.02 |
| Tax Rate, % | 12.9 | 12.9 | 12.9 | 12.9 | 12.9 | 12.9 | 12.9 | 12.9 | 12.9 | 12.9 |
| EBITAT | 51.6 | 125.1 | -389.1 | 718.9 | 178.5 | 44.8 | 42.9 | 41.2 | 39.5 | 37.9 |
| Depreciation | ||||||||||
| Changes in Account Receivables | ||||||||||
| Changes in Inventories | ||||||||||
| Changes in Accounts Payable | ||||||||||
| Capital Expenditure | ||||||||||
| UFCF | -54.4 | 307.1 | -167.1 | 829.9 | 322.5 | 415.7 | 247.5 | 237.4 | 227.7 | 218.4 |
| WACC, % | 6.67 | 7.31 | 8.69 | 8.69 | 8.28 | 7.93 | 7.93 | 7.93 | 7.93 | 7.93 |
| PV UFCF | ||||||||||
| SUM PV UFCF | 1,103.5 | |||||||||
| Long Term Growth Rate, % | 2.00 | |||||||||
| Free cash flow (T + 1) | 223 | |||||||||
| Terminal Value | 3,758 | |||||||||
| Present Terminal Value | 2,566 | |||||||||
| Enterprise Value | 3,670 | |||||||||
| Net Debt | 786 | |||||||||
| Equity Value | 2,884 | |||||||||
| Diluted Shares Outstanding, MM | 1,135 | |||||||||
| Equity Value Per Share | 254.10 |
What You Will Receive
- Pre-Loaded Financial Model: Currys plc’s actual data provides accurate DCF valuation.
- Comprehensive Forecast Control: Modify revenue growth, profit margins, WACC, and other essential factors.
- Immediate Calculations: Automatic updates allow you to view results in real-time as you make adjustments.
- Investor-Ready Format: A polished Excel file crafted for a professional-level valuation.
- Flexible and Reusable: Designed for adaptability, enabling repeated applications for in-depth forecasts.
Key Features
- Advanced DCF Calculator: Offers comprehensive unlevered and levered DCF valuation models tailored for Currys plc (CURYL).
- WACC Calculator: Comes with a pre-structured Weighted Average Cost of Capital sheet that allows for customizable inputs.
- Editability of Forecast Assumptions: Adjust growth rates, capital expenditures, and discount rates as needed.
- Integrated Financial Ratios: Evaluate profitability, leverage, and efficiency ratios specific to Currys plc (CURYL).
- Interactive Dashboard and Charts: Visual representations summarize essential valuation metrics for straightforward analysis.
How It Functions
- Download the Template: Gain immediate access to the Excel-based CURYL DCF Calculator.
- Input Your Assumptions: Modify the yellow-highlighted cells for growth rates, WACC, profit margins, and more.
- Instant Calculations: The model automatically recalculates Currys plc’s intrinsic value.
- Test Scenarios: Experiment with various assumptions to assess potential changes in valuation.
- Analyze and Decide: Leverage the results to inform your investment or financial analysis.
Why Select This Calculator for Currys plc (CURYL)?
- Precision: Utilizes authentic Currys plc financials for reliable data.
- Versatility: Built for users to easily experiment with and adjust inputs.
- Efficiency: Bypass the time-consuming process of creating a DCF model from the ground up.
- Expert-Quality: Crafted with the accuracy and usability expectations of finance professionals.
- Intuitive: Simple to navigate, even for users with limited financial modeling skills.
Who Should Utilize This Product?
- Investors: Accurately assess the fair value of Currys plc (CURYL) before making investment choices.
- CFOs: Utilize a professional-grade DCF model for financial analysis and reporting for Currys plc (CURYL).
- Consultants: Quickly customize the template for client valuation reports specifically for Currys plc (CURYL).
- Entrepreneurs: Discover financial modeling strategies employed by leading companies, including Currys plc (CURYL).
- Educators: Employ it as an educational resource to illustrate valuation methodologies relevant to Currys plc (CURYL).
Contents of the Template
- Pre-Filled DCF Model: Currys plc's (CURYL) financial data preloaded for instant application.
- WACC Calculator: Comprehensive calculations for the Weighted Average Cost of Capital.
- Financial Ratios: Assess Currys plc's profitability, leverage, and operational efficiency.
- Editable Inputs: Adjust assumptions such as growth rate, margins, and CAPEX to tailor to your scenarios.
- Financial Statements: Annual and quarterly reports for thorough analysis support.
- Interactive Dashboard: Effortlessly visualize critical valuation metrics and outcomes.
Disclaimer
All information, articles, and product details provided on this website are for general informational and educational purposes only. We do not claim any ownership over, nor do we intend to infringe upon, any trademarks, copyrights, logos, brand names, or other intellectual property mentioned or depicted on this site. Such intellectual property remains the property of its respective owners, and any references here are made solely for identification or informational purposes, without implying any affiliation, endorsement, or partnership.
We make no representations or warranties, express or implied, regarding the accuracy, completeness, or suitability of any content or products presented. Nothing on this website should be construed as legal, tax, investment, financial, medical, or other professional advice. In addition, no part of this site—including articles or product references—constitutes a solicitation, recommendation, endorsement, advertisement, or offer to buy or sell any securities, franchises, or other financial instruments, particularly in jurisdictions where such activity would be unlawful.
All content is of a general nature and may not address the specific circumstances of any individual or entity. It is not a substitute for professional advice or services. Any actions you take based on the information provided here are strictly at your own risk. You accept full responsibility for any decisions or outcomes arising from your use of this website and agree to release us from any liability in connection with your use of, or reliance upon, the content or products found herein.