
|
CVB Financial Corp. (CVBF) Avaliação DCF |
Totalmente Editável: Adapte-Se Às Suas Necessidades No Excel Ou Planilhas
Design Profissional: Modelos Confiáveis E Padrão Da Indústria
Pré-Construídos Para Uso Rápido E Eficiente
Compatível com MAC/PC, totalmente desbloqueado
Não É Necessária Experiência; Fácil De Seguir
CVB Financial Corp. (CVBF) Bundle
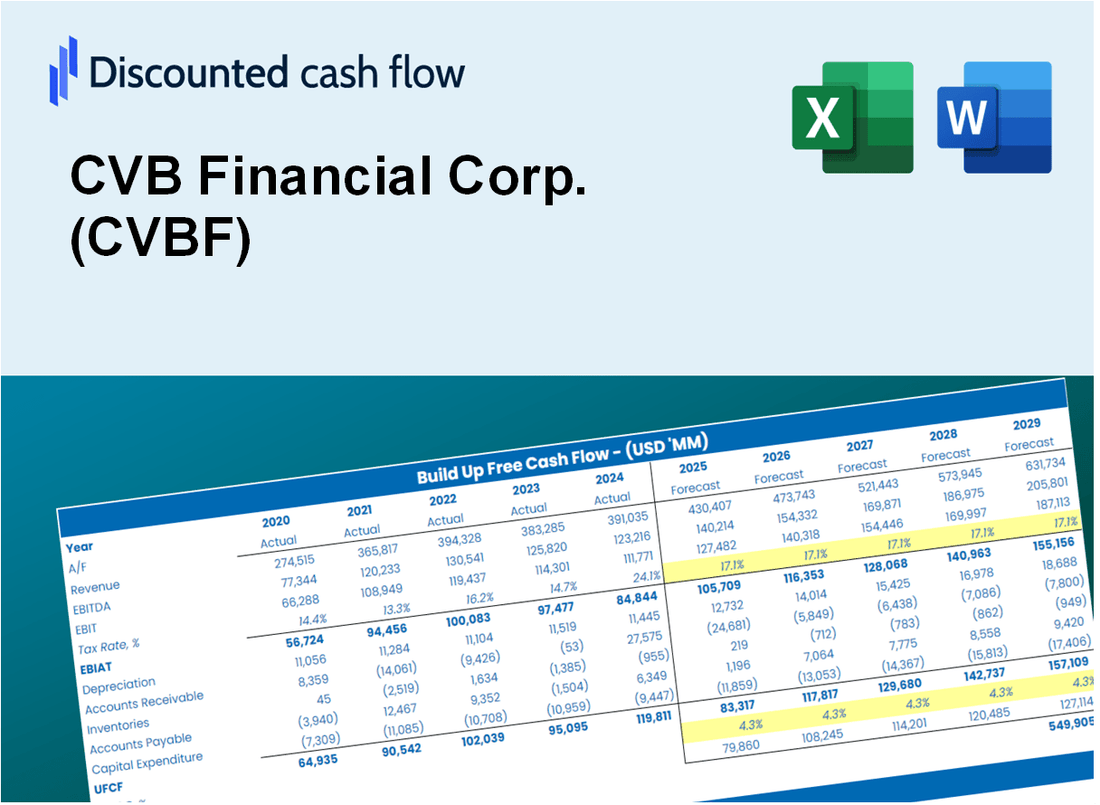
Descubra o verdadeiro valor da CVB Financial Corp. (CVBF) com nossa calculadora DCF avançada! Ajuste as suposições essenciais, explore vários cenários e examine como diferentes fatores afetam a avaliação da CVB Financial Corp. (CVBF) - tudo dentro de um modelo conveniente do Excel.
What You Will Receive
- Pre-Filled Financial Model: CVB Financial Corp.’s (CVBF) actual data provides an accurate DCF valuation.
- Comprehensive Forecast Control: Modify revenue growth, profit margins, WACC, and other essential metrics.
- Real-Time Calculations: Automatic updates allow you to view results instantly as adjustments are made.
- Professional-Grade Template: A polished Excel file crafted for high-quality valuation analysis.
- Flexible and Reusable: Designed for adaptability, enabling repeated use for in-depth forecasts.
Key Features
- Comprehensive DCF Calculator: Features detailed unlevered and levered DCF valuation models tailored for CVB Financial Corp. (CVBF).
- WACC Calculator: Includes a pre-built Weighted Average Cost of Capital sheet with adjustable inputs specific to CVBF.
- Customizable Forecast Assumptions: Adjust growth rates, capital expenditures, and discount rates according to CVB Financial Corp.'s (CVBF) projections.
- Integrated Financial Ratios: Evaluate profitability, leverage, and efficiency ratios for CVB Financial Corp. (CVBF).
- Interactive Dashboard and Charts: Visual representations summarize essential valuation metrics for straightforward analysis of CVBF.
How It Works
- Step 1: Download the Excel file.
- Step 2: Review CVB Financial Corp.'s (CVBF) pre-filled financial data and forecasts.
- Step 3: Modify key inputs such as revenue growth, WACC, and tax rates (highlighted cells).
- Step 4: Observe the DCF model update in real-time as you adjust your assumptions.
- Step 5: Analyze the outputs and leverage the results for your investment decisions.
Why Choose CVB Financial Corp. (CVBF) Calculator?
- Accuracy: Utilizes real CVB Financial Corp. data to ensure precision.
- Flexibility: Allows users to easily test and alter inputs as needed.
- Time-Saving: Avoid the complexities of creating a financial model from the ground up.
- Professional-Grade: Crafted with the expertise and usability expected at the CFO level.
- User-Friendly: Intuitive design makes it accessible for users without extensive financial modeling skills.
Who Should Use CVB Financial Corp. (CVBF)?
- Investors: Make informed choices with a reliable resource for understanding CVBF's financial performance.
- Financial Analysts: Streamline your analysis with comprehensive data and insights specific to CVBF.
- Consultants: Easily tailor reports and presentations focused on CVB Financial Corp. (CVBF) for your clients.
- Finance Enthusiasts: Enhance your knowledge of banking and finance through case studies involving CVB Financial Corp. (CVBF).
- Educators and Students: Utilize CVBF as a practical example in finance and investment courses.
What the Template Contains
- Historical Data: Includes CVB Financial Corp.'s (CVBF) past financials and baseline forecasts.
- DCF and Levered DCF Models: Detailed templates to calculate CVB Financial Corp.'s (CVBF) intrinsic value.
- WACC Sheet: Pre-built calculations for Weighted Average Cost of Capital.
- Editable Inputs: Modify key drivers like growth rates, EBITDA %, and CAPEX assumptions.
- Quarterly and Annual Statements: A complete breakdown of CVB Financial Corp.'s (CVBF) financials.
- Interactive Dashboard: Visualize valuation results and projections dynamically.
Disclaimer
All information, articles, and product details provided on this website are for general informational and educational purposes only. We do not claim any ownership over, nor do we intend to infringe upon, any trademarks, copyrights, logos, brand names, or other intellectual property mentioned or depicted on this site. Such intellectual property remains the property of its respective owners, and any references here are made solely for identification or informational purposes, without implying any affiliation, endorsement, or partnership.
We make no representations or warranties, express or implied, regarding the accuracy, completeness, or suitability of any content or products presented. Nothing on this website should be construed as legal, tax, investment, financial, medical, or other professional advice. In addition, no part of this site—including articles or product references—constitutes a solicitation, recommendation, endorsement, advertisement, or offer to buy or sell any securities, franchises, or other financial instruments, particularly in jurisdictions where such activity would be unlawful.
All content is of a general nature and may not address the specific circumstances of any individual or entity. It is not a substitute for professional advice or services. Any actions you take based on the information provided here are strictly at your own risk. You accept full responsibility for any decisions or outcomes arising from your use of this website and agree to release us from any liability in connection with your use of, or reliance upon, the content or products found herein.