
|
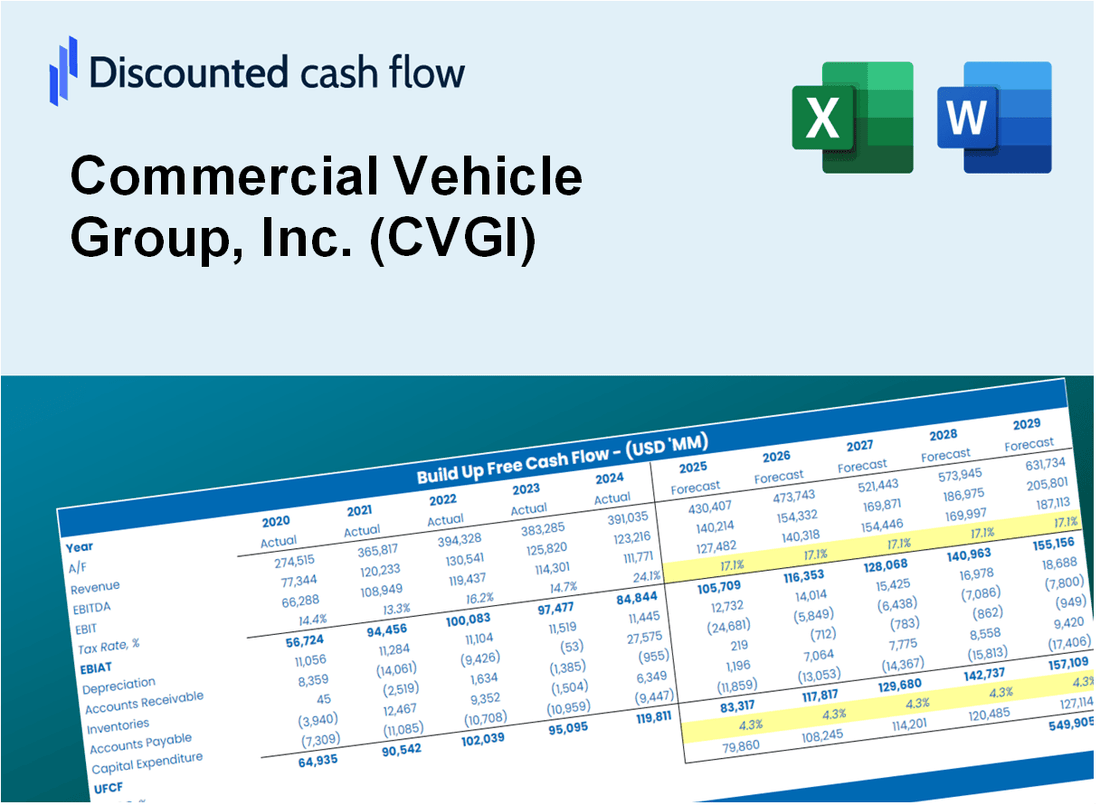
Avaliação DCF do Grupo de Veículos Comerciais, Inc. (CVGI) |
Totalmente Editável: Adapte-Se Às Suas Necessidades No Excel Ou Planilhas
Design Profissional: Modelos Confiáveis E Padrão Da Indústria
Pré-Construídos Para Uso Rápido E Eficiente
Compatível com MAC/PC, totalmente desbloqueado
Não É Necessária Experiência; Fácil De Seguir
Commercial Vehicle Group, Inc. (CVGI) Bundle
Avalie as perspectivas financeiras do Commercial Vehicle Group, Inc. (CVGI) com precisão especializada! Esta calculadora DCF (CVGI) fornece dados financeiros pré-populados e flexibilidade total para modificar o crescimento da receita, WACC, margens e outras suposições cruciais para se alinhar às suas projeções.
Discounted Cash Flow (DCF) - (USD MM)
| Year | AY1 2020 |
AY2 2021 |
AY3 2022 |
AY4 2023 |
AY5 2024 |
FY1 2025 |
FY2 2026 |
FY3 2027 |
FY4 2028 |
FY5 2029 |
|---|---|---|---|---|---|---|---|---|---|---|
| Revenue | 717.7 | 971.6 | 782.6 | 835.5 | 723.4 | 740.1 | 757.2 | 774.8 | 792.7 | 811.1 |
| Revenue Growth, % | 0 | 35.37 | -19.45 | 6.76 | -13.42 | 2.32 | 2.32 | 2.32 | 2.32 | 2.32 |
| EBITDA | 24.6 | 68.5 | 42.6 | 58.3 | 26.4 | 39.3 | 40.2 | 41.1 | 42.1 | 43.1 |
| EBITDA, % | 3.43 | 7.05 | 5.44 | 6.98 | 3.65 | 5.31 | 5.31 | 5.31 | 5.31 | 5.31 |
| Depreciation | 18.5 | 18.5 | 18.2 | 17.6 | 17.4 | 16.8 | 17.1 | 17.5 | 17.9 | 18.4 |
| Depreciation, % | 2.58 | 1.9 | 2.32 | 2.11 | 2.4 | 2.26 | 2.26 | 2.26 | 2.26 | 2.26 |
| EBIT | 6.1 | 50.0 | 24.4 | 40.7 | 9.0 | 22.6 | 23.1 | 23.6 | 24.2 | 24.7 |
| EBIT, % | 0.85454 | 5.15 | 3.12 | 4.87 | 1.25 | 3.05 | 3.05 | 3.05 | 3.05 | 3.05 |
| Total Cash | 50.5 | 35.0 | 31.8 | 37.8 | 26.6 | 33.9 | 34.7 | 35.5 | 36.3 | 37.2 |
| Total Cash, percent | .0 | .0 | .0 | .0 | .0 | .0 | .0 | .0 | .0 | .0 |
| Account Receivables | 151.1 | 174.5 | 152.6 | 129.3 | 118.7 | 133.8 | 136.9 | 140.1 | 143.3 | 146.6 |
| Account Receivables, % | 21.05 | 17.96 | 19.5 | 15.48 | 16.41 | 18.08 | 18.08 | 18.08 | 18.08 | 18.08 |
| Inventories | 91.2 | 141.0 | 142.5 | 117.3 | 128.2 | 114.3 | 116.9 | 119.6 | 122.4 | 125.2 |
| Inventories, % | 12.71 | 14.52 | 18.21 | 14.04 | 17.73 | 15.44 | 15.44 | 15.44 | 15.44 | 15.44 |
| Accounts Payable | 112.4 | 101.9 | 122.1 | 75.2 | 77.0 | 90.9 | 93.0 | 95.1 | 97.3 | 99.6 |
| Accounts Payable, % | 15.66 | 10.49 | 15.6 | 9.01 | 10.65 | 12.28 | 12.28 | 12.28 | 12.28 | 12.28 |
| Capital Expenditure | -7.1 | -17.7 | -19.7 | -19.7 | -18.5 | -15.2 | -15.5 | -15.9 | -16.2 | -16.6 |
| Capital Expenditure, % | -0.99512 | -1.82 | -2.52 | -2.36 | -2.56 | -2.05 | -2.05 | -2.05 | -2.05 | -2.05 |
| Tax Rate, % | -238.15 | -238.15 | -238.15 | -238.15 | -238.15 | -238.15 | -238.15 | -238.15 | -238.15 | -238.15 |
| EBITAT | 5.1 | 37.0 | -125.3 | 34.2 | 30.5 | 15.4 | 15.7 | 16.1 | 16.5 | 16.9 |
| Depreciation | ||||||||||
| Changes in Account Receivables | ||||||||||
| Changes in Inventories | ||||||||||
| Changes in Accounts Payable | ||||||||||
| Capital Expenditure | ||||||||||
| UFCF | -113.5 | -45.9 | -86.3 | 33.8 | 30.8 | 29.7 | 13.7 | 14.0 | 14.4 | 14.7 |
| WACC, % | 6.58 | 6.19 | 3.07 | 6.62 | 7.29 | 5.95 | 5.95 | 5.95 | 5.95 | 5.95 |
| PV UFCF | ||||||||||
| SUM PV UFCF | 74.4 | |||||||||
| Long Term Growth Rate, % | 3.00 | |||||||||
| Free cash flow (T + 1) | 15 | |||||||||
| Terminal Value | 513 | |||||||||
| Present Terminal Value | 384 | |||||||||
| Enterprise Value | 459 | |||||||||
| Net Debt | 140 | |||||||||
| Equity Value | 319 | |||||||||
| Diluted Shares Outstanding, MM | 33 | |||||||||
| Equity Value Per Share | 9.55 |
What You Will Get
- Comprehensive CVGI Financials: Access to both historical and projected data for precise valuation.
- Customizable Inputs: Adjust WACC, tax rates, revenue growth, and capital expenditures as needed.
- Dynamic Calculations: Intrinsic value and NPV are computed in real-time.
- Scenario Analysis: Evaluate various scenarios to assess Commercial Vehicle Group's future performance.
- User-Friendly Interface: Designed for professionals while remaining easy to navigate for newcomers.
Key Features
- Comprehensive DCF Calculator: Features detailed unlevered and levered DCF valuation models tailored for Commercial Vehicle Group, Inc. (CVGI).
- WACC Calculator: Pre-designed Weighted Average Cost of Capital sheet with adjustable inputs specific to CVGI.
- Customizable Forecast Assumptions: Adjust growth rates, capital expenditures, and discount rates to fit CVGI's financial projections.
- Integrated Financial Ratios: Evaluate profitability, leverage, and efficiency ratios relevant to Commercial Vehicle Group, Inc. (CVGI).
- Interactive Dashboard and Charts: Visual representations summarize key valuation metrics for straightforward analysis of CVGI.
How It Works
- Download: Obtain the pre-formatted Excel file containing Commercial Vehicle Group, Inc. (CVGI) financial data.
- Customize: Modify projections, including sales growth, EBITDA %, and WACC.
- Update Automatically: The intrinsic value and NPV calculations refresh in real-time.
- Test Scenarios: Generate various forecasts and analyze results instantly.
- Make Decisions: Leverage the valuation insights to inform your investment choices.
Why Choose Commercial Vehicle Group, Inc. (CVGI)?
- Streamlined Solutions: Access comprehensive tools without the hassle of starting from scratch.
- Enhanced Precision: Dependable data and calculations minimize discrepancies in your assessments.
- Fully Adaptable: Customize offerings to align with your specific needs and forecasts.
- User-Friendly Interface: Intuitive visuals and outputs simplify data interpretation.
- Endorsed by Industry Leaders: Crafted for professionals who prioritize accuracy and efficiency.
Who Should Use This Product?
- Transportation Students: Understand industry-specific valuation methods and practice with real-world data.
- Researchers: Utilize comprehensive models in your studies or publications related to commercial vehicles.
- Investors: Evaluate your investment strategies and assess valuation scenarios for Commercial Vehicle Group, Inc. (CVGI).
- Market Analysts: Enhance your analysis process with a tailored, ready-to-use DCF model.
- Fleet Managers: Discover how large-scale commercial vehicle operations are evaluated and managed.
What the Template Contains
- Historical Data: Includes Commercial Vehicle Group, Inc.'s (CVGI) past financials and baseline forecasts.
- DCF and Levered DCF Models: Detailed templates to calculate Commercial Vehicle Group, Inc.'s (CVGI) intrinsic value.
- WACC Sheet: Pre-built calculations for Weighted Average Cost of Capital.
- Editable Inputs: Modify key drivers like growth rates, EBITDA %, and CAPEX assumptions.
- Quarterly and Annual Statements: A complete breakdown of Commercial Vehicle Group, Inc.'s (CVGI) financials.
- Interactive Dashboard: Visualize valuation results and projections dynamically.
Disclaimer
All information, articles, and product details provided on this website are for general informational and educational purposes only. We do not claim any ownership over, nor do we intend to infringe upon, any trademarks, copyrights, logos, brand names, or other intellectual property mentioned or depicted on this site. Such intellectual property remains the property of its respective owners, and any references here are made solely for identification or informational purposes, without implying any affiliation, endorsement, or partnership.
We make no representations or warranties, express or implied, regarding the accuracy, completeness, or suitability of any content or products presented. Nothing on this website should be construed as legal, tax, investment, financial, medical, or other professional advice. In addition, no part of this site—including articles or product references—constitutes a solicitation, recommendation, endorsement, advertisement, or offer to buy or sell any securities, franchises, or other financial instruments, particularly in jurisdictions where such activity would be unlawful.
All content is of a general nature and may not address the specific circumstances of any individual or entity. It is not a substitute for professional advice or services. Any actions you take based on the information provided here are strictly at your own risk. You accept full responsibility for any decisions or outcomes arising from your use of this website and agree to release us from any liability in connection with your use of, or reliance upon, the content or products found herein.