|
Calavo Growers, Inc. (CVGW) Avaliação DCF |
Totalmente Editável: Adapte-Se Às Suas Necessidades No Excel Ou Planilhas
Design Profissional: Modelos Confiáveis E Padrão Da Indústria
Pré-Construídos Para Uso Rápido E Eficiente
Compatível com MAC/PC, totalmente desbloqueado
Não É Necessária Experiência; Fácil De Seguir
Calavo Growers, Inc. (CVGW) Bundle
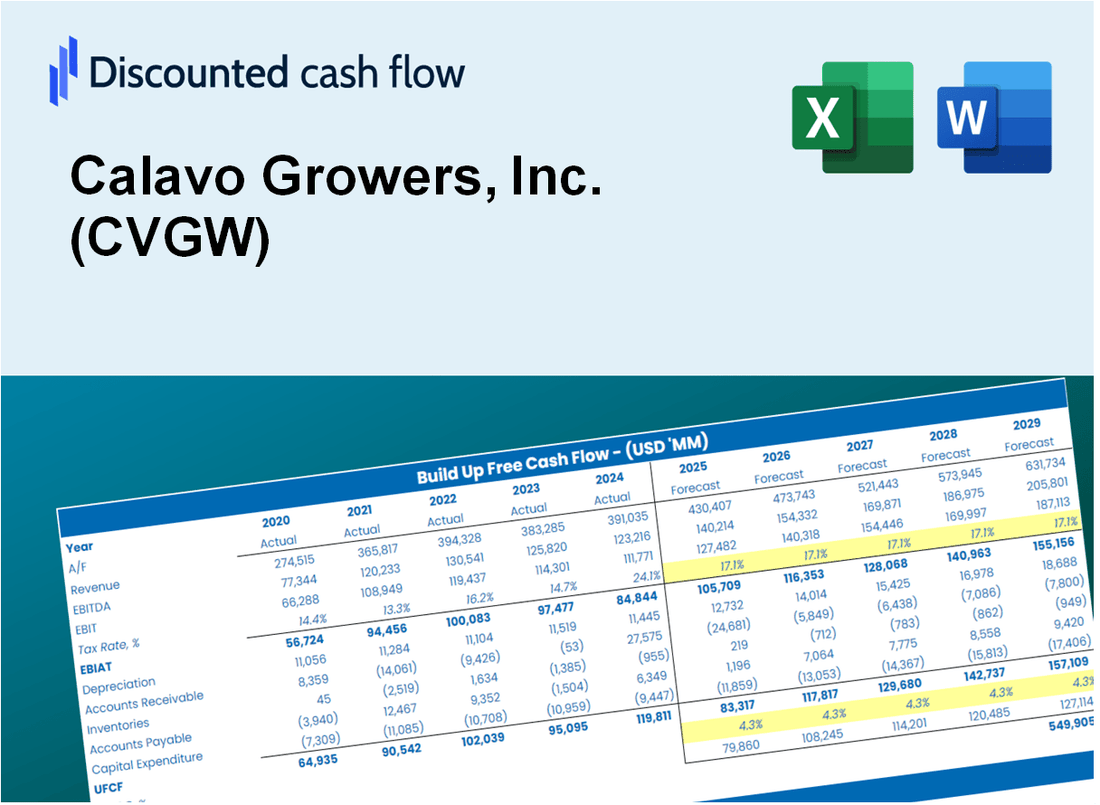
Descubra o verdadeiro valor da Calavo Growers, Inc. (CVGW) com nossa calculadora DCF de nível profissional! Ajuste as principais suposições, explore vários cenários e avalie como as mudanças afetam a avaliação da Calavo Growers, Inc. (CVGW) - tudo dentro de um único modelo do Excel.
Discounted Cash Flow (DCF) - (USD MM)
| Year | AY1 2020 |
AY2 2021 |
AY3 2022 |
AY4 2023 |
AY5 2024 |
FY1 2025 |
FY2 2026 |
FY3 2027 |
FY4 2028 |
FY5 2029 |
|---|---|---|---|---|---|---|---|---|---|---|
| Revenue | 1,059.4 | 1,055.8 | 1,191.1 | 971.9 | 661.5 | 598.9 | 542.2 | 490.9 | 444.5 | 402.4 |
| Revenue Growth, % | 0 | -0.33425 | 12.81 | -18.4 | -31.94 | -9.46 | -9.46 | -9.46 | -9.46 | -9.46 |
| EBITDA | 5.1 | 19.0 | 15.5 | 18.7 | 23.1 | 10.8 | 9.8 | 8.8 | 8.0 | 7.2 |
| EBITDA, % | 0.48359 | 1.8 | 1.3 | 1.92 | 3.5 | 1.8 | 1.8 | 1.8 | 1.8 | 1.8 |
| Depreciation | 16.3 | 17.7 | 16.6 | 17.3 | 10.6 | 9.6 | 8.7 | 7.8 | 7.1 | 6.4 |
| Depreciation, % | 1.54 | 1.67 | 1.39 | 1.78 | 1.6 | 1.6 | 1.6 | 1.6 | 1.6 | 1.6 |
| EBIT | -11.1 | 1.3 | -1.1 | 1.4 | 12.5 | 1.2 | 1.1 | 1.0 | .9 | .8 |
| EBIT, % | -1.05 | 0.1271 | -0.09243766 | 0.1427 | 1.9 | 0.20428 | 0.20428 | 0.20428 | 0.20428 | 0.20428 |
| Total Cash | 4.1 | 1.9 | 2.1 | 2.1 | 57.0 | 11.5 | 10.4 | 9.4 | 8.5 | 7.7 |
| Total Cash, percent | .0 | .0 | .0 | .0 | .0 | .0 | .0 | .0 | .0 | .0 |
| Account Receivables | 80.0 | 90.4 | 59.0 | 61.4 | 42.8 | 40.6 | 36.7 | 33.2 | 30.1 | 27.2 |
| Account Receivables, % | 7.55 | 8.56 | 4.95 | 6.31 | 6.48 | 6.77 | 6.77 | 6.77 | 6.77 | 6.77 |
| Inventories | 41.8 | 40.8 | 38.8 | 39.4 | 34.2 | 24.3 | 22.0 | 19.9 | 18.0 | 16.3 |
| Inventories, % | 3.94 | 3.86 | 3.26 | 4.06 | 5.16 | 4.06 | 4.06 | 4.06 | 4.06 | 4.06 |
| Accounts Payable | 20.7 | 32.8 | 30.7 | 30.3 | 27.1 | 17.8 | 16.1 | 14.6 | 13.2 | 12.0 |
| Accounts Payable, % | 1.96 | 3.11 | 2.57 | 3.12 | 4.1 | 2.97 | 2.97 | 2.97 | 2.97 | 2.97 |
| Capital Expenditure | -11.3 | -11.4 | -9.8 | -10.7 | -2.9 | -5.4 | -4.9 | -4.4 | -4.0 | -3.6 |
| Capital Expenditure, % | -1.07 | -1.08 | -0.82018 | -1.1 | -0.43686 | -0.90227 | -0.90227 | -0.90227 | -0.90227 | -0.90227 |
| Tax Rate, % | 111.73 | 111.73 | 111.73 | 111.73 | 111.73 | 111.73 | 111.73 | 111.73 | 111.73 | 111.73 |
| EBITAT | -7.2 | -25.2 | -2.4 | 5.7 | -1.5 | .6 | .6 | .5 | .5 | .4 |
| Depreciation | ||||||||||
| Changes in Account Receivables | ||||||||||
| Changes in Inventories | ||||||||||
| Changes in Accounts Payable | ||||||||||
| Capital Expenditure | ||||||||||
| UFCF | -103.3 | -16.3 | 35.6 | 9.0 | 26.8 | 7.6 | 8.8 | 8.0 | 7.2 | 6.5 |
| WACC, % | 5.58 | 5.12 | 5.84 | 5.84 | 5.12 | 5.5 | 5.5 | 5.5 | 5.5 | 5.5 |
| PV UFCF | ||||||||||
| SUM PV UFCF | 32.8 | |||||||||
| Long Term Growth Rate, % | 3.50 | |||||||||
| Free cash flow (T + 1) | 7 | |||||||||
| Terminal Value | 338 | |||||||||
| Present Terminal Value | 259 | |||||||||
| Enterprise Value | 291 | |||||||||
| Net Debt | -31 | |||||||||
| Equity Value | 323 | |||||||||
| Diluted Shares Outstanding, MM | 18 | |||||||||
| Equity Value Per Share | 18.06 |
What You Will Get
- Real Calavo Data: Preloaded financials – from revenue to EBIT – based on actual and projected figures for Calavo Growers, Inc. (CVGW).
- Full Customization: Adjust all critical parameters (yellow cells) like WACC, growth %, and tax rates specific to Calavo Growers, Inc. (CVGW).
- Instant Valuation Updates: Automatic recalculations to analyze the impact of changes on Calavo Growers, Inc. (CVGW)’s fair value.
- Versatile Excel Template: Tailored for quick edits, scenario testing, and detailed projections for Calavo Growers, Inc. (CVGW).
- Time-Saving and Accurate: Skip building models from scratch while maintaining precision and flexibility for Calavo Growers, Inc. (CVGW).
Key Features
- Comprehensive CVGW Data: Pre-loaded with Calavo Growers’ historical performance metrics and future growth estimates.
- Customizable Assumptions: Modify key factors such as revenue growth rates, profit margins, discount rates, tax implications, and capital investments.
- Interactive Valuation Framework: Real-time adjustments to Net Present Value (NPV) and intrinsic value based on user-defined parameters.
- Multiple Scenario Analysis: Develop various forecasting scenarios to evaluate different valuation possibilities.
- Intuitive User Interface: Designed for ease of use, catering to both industry experts and newcomers.
How It Works
- Step 1: Download the Excel file.
- Step 2: Review pre-entered Calavo Growers data (historical and projected).
- Step 3: Adjust key assumptions (yellow cells) based on your analysis.
- Step 4: View automatic recalculations for Calavo Growers' intrinsic value.
- Step 5: Use the outputs for investment decisions or reporting.
Why Choose Calavo Growers, Inc. (CVGW)?
- Fresh Quality: Experience premium avocados and produce sourced directly from our farms.
- Innovative Solutions: Cutting-edge technology ensures efficient supply chain management.
- Commitment to Sustainability: We prioritize eco-friendly practices in all our operations.
- Expertise in the Industry: Decades of experience guarantee the highest standards of quality and service.
- Customer-Centric Approach: Tailored services to meet the unique needs of our clients.
Who Should Use Calavo Growers, Inc. (CVGW)?
- Professional Investors: Develop comprehensive and accurate valuation models for analyzing portfolios that include Calavo Growers, Inc. (CVGW).
- Corporate Finance Teams: Evaluate valuation scenarios to inform strategic decisions within their organizations.
- Consultants and Advisors: Deliver precise valuation insights regarding Calavo Growers, Inc. (CVGW) to clients seeking investment opportunities.
- Students and Educators: Utilize real-world data from Calavo Growers, Inc. (CVGW) to enhance learning and practice in financial modeling.
- Agriculture Analysts: Gain insights into the valuation of agricultural companies like Calavo Growers, Inc. (CVGW) in the market.
What the Template Contains
- Operating and Balance Sheet Data: Pre-filled Calavo Growers, Inc. (CVGW) historical data and forecasts, including revenue, EBITDA, EBIT, and capital expenditures.
- WACC Calculation: A dedicated sheet for Weighted Average Cost of Capital (WACC), including parameters like Beta, risk-free rate, and share price.
- DCF Valuation (Unlevered and Levered): Editable Discounted Cash Flow models showing intrinsic value with detailed calculations.
- Financial Statements: Pre-loaded financial statements (annual and quarterly) to support analysis.
- Key Ratios: Includes profitability, leverage, and efficiency ratios for Calavo Growers, Inc. (CVGW).
- Dashboard and Charts: Visual summary of valuation outputs and assumptions to analyze results easily.
Disclaimer
All information, articles, and product details provided on this website are for general informational and educational purposes only. We do not claim any ownership over, nor do we intend to infringe upon, any trademarks, copyrights, logos, brand names, or other intellectual property mentioned or depicted on this site. Such intellectual property remains the property of its respective owners, and any references here are made solely for identification or informational purposes, without implying any affiliation, endorsement, or partnership.
We make no representations or warranties, express or implied, regarding the accuracy, completeness, or suitability of any content or products presented. Nothing on this website should be construed as legal, tax, investment, financial, medical, or other professional advice. In addition, no part of this site—including articles or product references—constitutes a solicitation, recommendation, endorsement, advertisement, or offer to buy or sell any securities, franchises, or other financial instruments, particularly in jurisdictions where such activity would be unlawful.
All content is of a general nature and may not address the specific circumstances of any individual or entity. It is not a substitute for professional advice or services. Any actions you take based on the information provided here are strictly at your own risk. You accept full responsibility for any decisions or outcomes arising from your use of this website and agree to release us from any liability in connection with your use of, or reliance upon, the content or products found herein.