
|
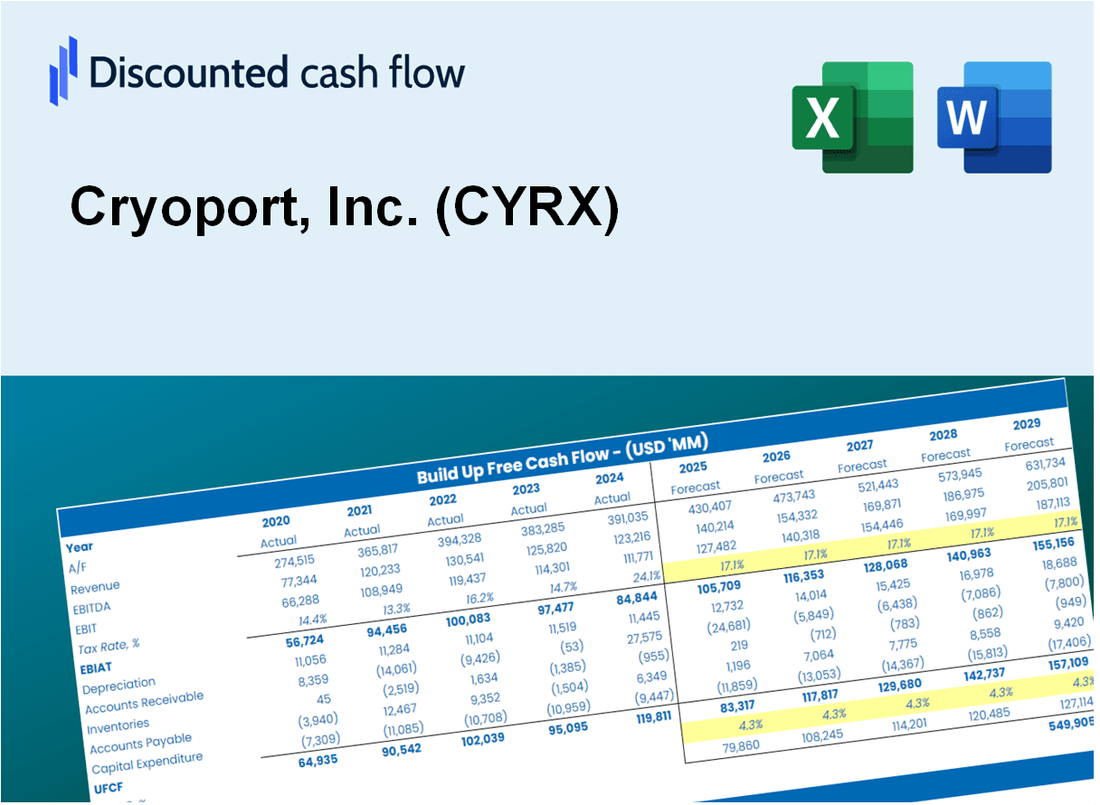
Avaliação DCF Cryoport, Inc. (CYRX) |
Totalmente Editável: Adapte-Se Às Suas Necessidades No Excel Ou Planilhas
Design Profissional: Modelos Confiáveis E Padrão Da Indústria
Pré-Construídos Para Uso Rápido E Eficiente
Compatível com MAC/PC, totalmente desbloqueado
Não É Necessária Experiência; Fácil De Seguir
Cryoport, Inc. (CYRX) Bundle
Simplifique a avaliação Cryoport, Inc. (CYRX) com esta calculadora DCF personalizável! Com o Real Cryoport, Inc. (CYRX) financeiras e insumos de previsão ajustáveis, você pode testar cenários e descobrir o valor justo Cryoport, Inc. (CYRX) em minutos.
Discounted Cash Flow (DCF) - (USD MM)
| Year | AY1 2019 |
AY2 2020 |
AY3 2021 |
AY4 2022 |
AY5 2023 |
FY1 2024 |
FY2 2025 |
FY3 2026 |
FY4 2027 |
FY5 2028 |
|---|---|---|---|---|---|---|---|---|---|---|
| Revenue | 78.7 | 222.6 | 237.3 | 233.3 | 228.4 | 287.1 | 360.9 | 453.6 | 570.2 | 716.8 |
| Revenue Growth, % | 0 | 182.87 | 6.59 | -1.7 | -2.09 | 25.7 | 25.7 | 25.7 | 25.7 | 25.7 |
| EBITDA | -20.3 | -248.9 | -6.2 | -66.4 | -78.6 | -109.8 | -138.1 | -173.5 | -218.1 | -274.2 |
| EBITDA, % | -25.81 | -111.81 | -2.61 | -28.45 | -34.42 | -38.26 | -38.26 | -38.26 | -38.26 | -38.26 |
| Depreciation | 9.9 | 20.2 | 22.8 | 27.5 | 30.8 | 32.4 | 40.8 | 51.2 | 64.4 | 81.0 |
| Depreciation, % | 12.54 | 9.1 | 9.59 | 11.78 | 13.47 | 11.3 | 11.3 | 11.3 | 11.3 | 11.3 |
| EBIT | -30.2 | -269.2 | -29.0 | -93.8 | -109.4 | -137.0 | -172.3 | -216.5 | -272.2 | -342.1 |
| EBIT, % | -38.35 | -120.91 | -12.2 | -40.23 | -47.89 | -47.73 | -47.73 | -47.73 | -47.73 | -47.73 |
| Total Cash | 93.3 | 628.8 | 523.3 | 456.8 | 261.7 | 287.1 | 360.9 | 453.6 | 570.2 | 716.8 |
| Total Cash, percent | .0 | .0 | .0 | .0 | .0 | .0 | .0 | .0 | .0 | .0 |
| Account Receivables | 31.4 | 39.4 | 43.9 | 42.1 | 45.8 | 65.5 | 82.4 | 103.6 | 130.2 | 163.6 |
| Account Receivables, % | 39.87 | 17.7 | 18.48 | 18.04 | 20.04 | 22.83 | 22.83 | 22.83 | 22.83 | 22.83 |
| Inventories | 10.5 | 16.5 | 27.7 | 26.2 | 22.5 | 30.7 | 38.6 | 48.6 | 61.1 | 76.7 |
| Inventories, % | 13.39 | 7.41 | 11.66 | 11.23 | 9.84 | 10.71 | 10.71 | 10.71 | 10.71 | 10.71 |
| Accounts Payable | 24.3 | 27.7 | 27.0 | 26.1 | 26.2 | 44.4 | 55.9 | 70.2 | 88.3 | 110.9 |
| Accounts Payable, % | 30.93 | 12.44 | 11.4 | 11.17 | 11.46 | 15.48 | 15.48 | 15.48 | 15.48 | 15.48 |
| Capital Expenditure | -9.7 | -25.0 | -24.2 | -44.9 | -17.3 | -34.7 | -43.7 | -54.9 | -69.0 | -86.8 |
| Capital Expenditure, % | -12.29 | -11.23 | -10.2 | -19.25 | -7.55 | -12.1 | -12.1 | -12.1 | -12.1 | -12.1 |
| Tax Rate, % | -1.12 | -1.12 | -1.12 | -1.12 | -1.12 | -1.12 | -1.12 | -1.12 | -1.12 | -1.12 |
| EBITAT | -30.1 | -270.8 | -30.8 | -94.1 | -110.6 | -137.0 | -172.2 | -216.5 | -272.1 | -342.0 |
| Depreciation | ||||||||||
| Changes in Account Receivables | ||||||||||
| Changes in Inventories | ||||||||||
| Changes in Accounts Payable | ||||||||||
| Capital Expenditure | ||||||||||
| UFCF | -47.5 | -286.2 | -48.5 | -109.2 | -97.0 | -149.1 | -188.5 | -236.9 | -297.8 | -374.3 |
| WACC, % | 8.65 | 8.65 | 8.65 | 8.65 | 8.65 | 8.65 | 8.65 | 8.65 | 8.65 | 8.65 |
| PV UFCF | ||||||||||
| SUM PV UFCF | -942.4 | |||||||||
| Long Term Growth Rate, % | 2.00 | |||||||||
| Free cash flow (T + 1) | -382 | |||||||||
| Terminal Value | -5,739 | |||||||||
| Present Terminal Value | -3,790 | |||||||||
| Enterprise Value | -4,733 | |||||||||
| Net Debt | 205 | |||||||||
| Equity Value | -4,938 | |||||||||
| Diluted Shares Outstanding, MM | 49 | |||||||||
| Equity Value Per Share | -100.06 |
What You Will Get
- Real CYRX Financial Data: Pre-filled with Cryoport’s historical and projected data for precise analysis.
- Fully Editable Template: Modify key inputs like revenue growth, WACC, and EBITDA % with ease.
- Automatic Calculations: See Cryoport’s intrinsic value update instantly based on your changes.
- Professional Valuation Tool: Designed for investors, analysts, and consultants seeking accurate DCF results.
- User-Friendly Design: Simple structure and clear instructions for all experience levels.
Key Features
- Comprehensive CYRX Data: Pre-loaded with Cryoport’s historical performance metrics and future projections.
- Customizable Financial Inputs: Modify revenue growth rates, profit margins, WACC, tax rates, and capital expenditures as needed.
- Interactive Valuation Model: Automatically recalculates Net Present Value (NPV) and intrinsic value based on user-defined inputs.
- Scenario Analysis: Develop various forecasting scenarios to evaluate different valuation possibilities.
- Intuitive User Interface: Designed for ease of use, catering to both seasoned professionals and newcomers.
How It Works
- Step 1: Download the prebuilt Excel template featuring Cryoport, Inc.'s (CYRX) data.
- Step 2: Navigate through the pre-filled sheets to familiarize yourself with the essential metrics.
- Step 3: Modify forecasts and assumptions in the editable yellow cells (WACC, growth, margins).
- Step 4: Instantly view updated results, including Cryoport, Inc.'s (CYRX) intrinsic value.
- Step 5: Make well-informed investment choices or create reports based on the outputs.
Why Choose This Calculator for Cryoport, Inc. (CYRX)?
- All-in-One Solution: Combines DCF, WACC, and financial ratio analyses tailored for Cryoport, Inc. (CYRX).
- Flexible Inputs: Modify yellow-highlighted cells to explore different financial scenarios.
- In-Depth Analysis: Automatically computes Cryoport, Inc.'s (CYRX) intrinsic value and Net Present Value.
- Preloaded Information: Access to historical and projected data for precise analysis.
- Expert-Level Resources: Perfect for financial analysts, investors, and business consultants focusing on Cryoport, Inc. (CYRX).
Who Should Use Cryoport, Inc. (CYRX)?
- Healthcare Professionals: Understand the logistics of temperature-controlled supply chains in the biopharmaceutical industry.
- Researchers: Utilize Cryoport's services to ensure the integrity of sensitive biological samples.
- Investors: Evaluate market trends and performance metrics related to Cryoport, Inc. (CYRX) for informed investment decisions.
- Pharmaceutical Companies: Optimize your shipping processes with Cryoport's specialized cold chain solutions.
- Regulatory Bodies: Ensure compliance with industry standards for the transportation of temperature-sensitive products.
What the Template Contains
- Historical Data: Includes Cryoport, Inc.’s (CYRX) past financials and baseline forecasts.
- DCF and Levered DCF Models: Detailed templates to calculate Cryoport, Inc.’s (CYRX) intrinsic value.
- WACC Sheet: Pre-built calculations for Weighted Average Cost of Capital.
- Editable Inputs: Modify key drivers like growth rates, EBITDA %, and CAPEX assumptions.
- Quarterly and Annual Statements: A complete breakdown of Cryoport, Inc.’s (CYRX) financials.
- Interactive Dashboard: Visualize valuation results and projections dynamically.
Disclaimer
All information, articles, and product details provided on this website are for general informational and educational purposes only. We do not claim any ownership over, nor do we intend to infringe upon, any trademarks, copyrights, logos, brand names, or other intellectual property mentioned or depicted on this site. Such intellectual property remains the property of its respective owners, and any references here are made solely for identification or informational purposes, without implying any affiliation, endorsement, or partnership.
We make no representations or warranties, express or implied, regarding the accuracy, completeness, or suitability of any content or products presented. Nothing on this website should be construed as legal, tax, investment, financial, medical, or other professional advice. In addition, no part of this site—including articles or product references—constitutes a solicitation, recommendation, endorsement, advertisement, or offer to buy or sell any securities, franchises, or other financial instruments, particularly in jurisdictions where such activity would be unlawful.
All content is of a general nature and may not address the specific circumstances of any individual or entity. It is not a substitute for professional advice or services. Any actions you take based on the information provided here are strictly at your own risk. You accept full responsibility for any decisions or outcomes arising from your use of this website and agree to release us from any liability in connection with your use of, or reliance upon, the content or products found herein.