
|
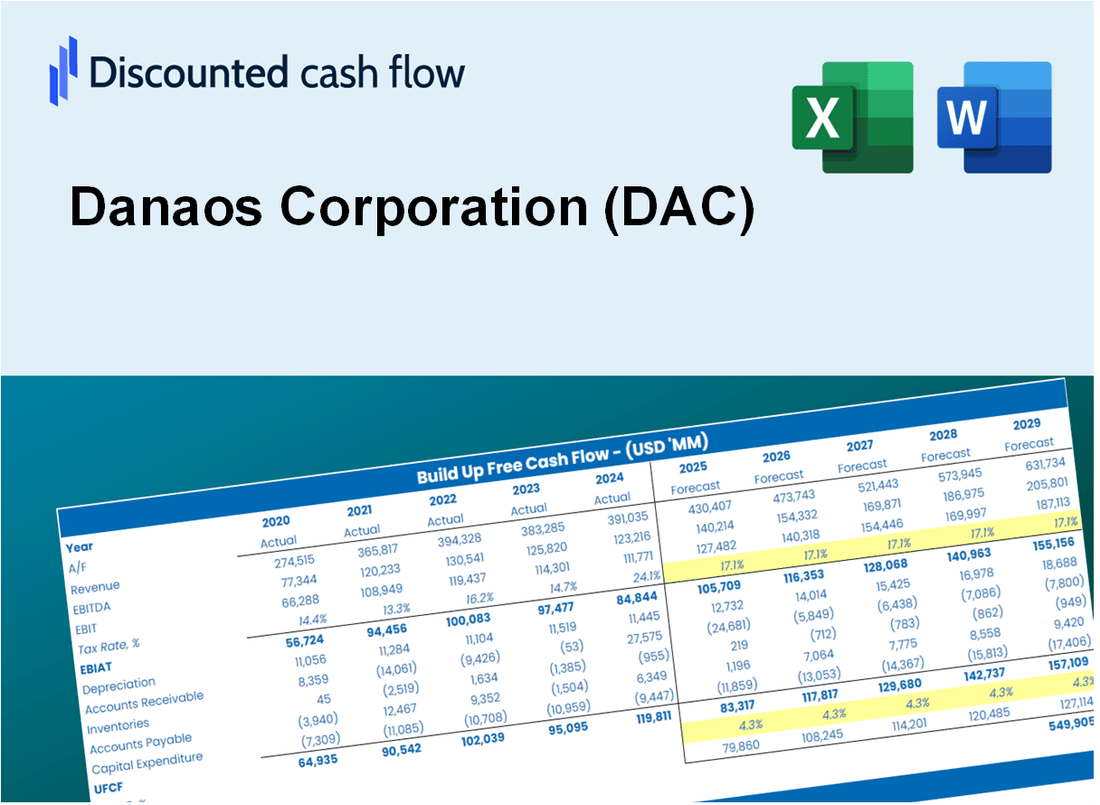
Avaliação DCF da Danaos Corporation (DAC) |
Totalmente Editável: Adapte-Se Às Suas Necessidades No Excel Ou Planilhas
Design Profissional: Modelos Confiáveis E Padrão Da Indústria
Pré-Construídos Para Uso Rápido E Eficiente
Compatível com MAC/PC, totalmente desbloqueado
Não É Necessária Experiência; Fácil De Seguir
Danaos Corporation (DAC) Bundle
Simplifique sua análise e melhore a precisão com a nossa calculadora DCF (DAC)! Utilizando dados reais da Danaos Corporation e suposições personalizáveis, essa ferramenta o capacita a prever, avaliar e avaliar (DAC) como um investidor experiente.
Discounted Cash Flow (DCF) - (USD MM)
| Year | AY1 2020 |
AY2 2021 |
AY3 2022 |
AY4 2023 |
AY5 2024 |
FY1 2025 |
FY2 2026 |
FY3 2027 |
FY4 2028 |
FY5 2029 |
|---|---|---|---|---|---|---|---|---|---|---|
| Revenue | 461.6 | 689.5 | 993.3 | 973.6 | 1,014.1 | 1,025.6 | 1,037.3 | 1,049.1 | 1,061.0 | 1,073.1 |
| Revenue Growth, % | 0 | 49.37 | 44.07 | -1.99 | 4.16 | 1.14 | 1.14 | 1.14 | 1.14 | 1.14 |
| EBITDA | 315.6 | 444.5 | 787.6 | 704.8 | 675.1 | 720.2 | 728.4 | 736.7 | 745.1 | 753.5 |
| EBITDA, % | 68.38 | 64.46 | 79.29 | 72.4 | 66.57 | 70.22 | 70.22 | 70.22 | 70.22 | 70.22 |
| Depreciation | 112.6 | 127.1 | 146.4 | 108.1 | 143.8 | 169.9 | 171.9 | 173.8 | 175.8 | 177.8 |
| Depreciation, % | 24.39 | 18.43 | 14.74 | 11.1 | 14.18 | 16.57 | 16.57 | 16.57 | 16.57 | 16.57 |
| EBIT | 203.1 | 317.4 | 641.2 | 596.8 | 531.3 | 550.3 | 556.5 | 562.9 | 569.3 | 575.7 |
| EBIT, % | 44 | 46.03 | 64.55 | 61.3 | 52.39 | 53.65 | 53.65 | 53.65 | 53.65 | 53.65 |
| Total Cash | 65.7 | 552.4 | 267.7 | 357.8 | 514.2 | 428.2 | 433.1 | 438.0 | 443.0 | 448.0 |
| Total Cash, percent | .0 | .0 | .0 | .0 | .0 | .0 | .0 | .0 | .0 | .0 |
| Account Receivables | 28.0 | 37.9 | 54.8 | 73.4 | 92.5 | 69.2 | 70.0 | 70.8 | 71.6 | 72.4 |
| Account Receivables, % | 6.06 | 5.5 | 5.52 | 7.54 | 9.12 | 6.75 | 6.75 | 6.75 | 6.75 | 6.75 |
| Inventories | 9.6 | 12.6 | 16.1 | 24.5 | 23.9 | 21.3 | 21.6 | 21.8 | 22.1 | 22.3 |
| Inventories, % | 2.08 | 1.82 | 1.62 | 2.52 | 2.35 | 2.08 | 2.08 | 2.08 | 2.08 | 2.08 |
| Accounts Payable | 10.6 | 18.9 | 24.5 | 22.8 | 29.0 | 26.1 | 26.4 | 26.7 | 27.0 | 27.3 |
| Accounts Payable, % | 2.3 | 2.74 | 2.47 | 2.34 | 2.86 | 2.54 | 2.54 | 2.54 | 2.54 | 2.54 |
| Capital Expenditure | -170.7 | -355.7 | -199.1 | -268.0 | -659.3 | -412.6 | -417.3 | -422.1 | -426.9 | -431.7 |
| Capital Expenditure, % | -36.97 | -51.59 | -20.05 | -27.53 | -65.02 | -40.23 | -40.23 | -40.23 | -40.23 | -40.23 |
| Tax Rate, % | 0 | 0 | 0 | 0 | 0 | 0 | 0 | 0 | 0 | 0 |
| EBITAT | 123.2 | 337.3 | 620.9 | 596.8 | 531.3 | 503.5 | 509.2 | 515.0 | 520.9 | 526.8 |
| Depreciation | ||||||||||
| Changes in Account Receivables | ||||||||||
| Changes in Inventories | ||||||||||
| Changes in Accounts Payable | ||||||||||
| Capital Expenditure | ||||||||||
| UFCF | 38.1 | 104.1 | 553.4 | 408.1 | 3.4 | 283.7 | 263.0 | 266.0 | 269.1 | 272.1 |
| WACC, % | 7.29 | 7.74 | 7.71 | 7.74 | 7.74 | 7.64 | 7.64 | 7.64 | 7.64 | 7.64 |
| PV UFCF | ||||||||||
| SUM PV UFCF | 1,092.5 | |||||||||
| Long Term Growth Rate, % | 0.50 | |||||||||
| Free cash flow (T + 1) | 273 | |||||||||
| Terminal Value | 3,828 | |||||||||
| Present Terminal Value | 2,649 | |||||||||
| Enterprise Value | 3,742 | |||||||||
| Net Debt | 281 | |||||||||
| Equity Value | 3,460 | |||||||||
| Diluted Shares Outstanding, MM | 19 | |||||||||
| Equity Value Per Share | 178.49 |
What You Will Get
- Comprehensive DAC Financials: Access to both historical and projected data for precise valuation.
- Customizable Inputs: Adjust WACC, tax rates, revenue growth, and capital expenses as needed.
- Real-Time Calculations: Intrinsic value and NPV are computed automatically.
- Scenario Analysis: Evaluate various scenarios to assess Danaos Corporation’s future performance.
- User-Friendly Design: Designed for experts while remaining approachable for newcomers.
Key Features
- Customizable Financial Metrics: Adjust essential variables such as revenue growth, EBITDA margin, and capital expenditures.
- Instant DCF Valuation: Quickly computes intrinsic value, NPV, and other financial metrics.
- High-Precision Accuracy: Leverages Danaos Corporation’s (DAC) actual financial data for credible valuation results.
- Simplified Scenario Analysis: Effortlessly evaluate various assumptions and analyze their impacts.
- Efficiency Booster: Avoid the hassle of constructing intricate valuation models from the ground up.
How It Works
- Step 1: Download the Excel file.
- Step 2: Review pre-entered Danaos Corporation (DAC) data (historical and projected).
- Step 3: Adjust key assumptions (yellow cells) based on your analysis.
- Step 4: View automatic recalculations for Danaos Corporation’s (DAC) intrinsic value.
- Step 5: Use the outputs for investment decisions or reporting.
Why Choose the Danaos Corporation (DAC) Calculator?
- Accuracy: Utilizes real Danaos Corporation financials for precise data.
- Flexibility: Tailored for users to easily test and adjust inputs as needed.
- Time-Saving: Avoid the complexities of constructing a DCF model from the ground up.
- Professional-Grade: Crafted with the expertise and usability expected at the CFO level.
- User-Friendly: Intuitive design makes it accessible for those without extensive financial modeling skills.
Who Should Use This Product?
- Finance Students: Explore valuation methodologies and apply them with real-time data for Danaos Corporation (DAC).
- Academics: Integrate industry-standard models into your curriculum or research involving Danaos Corporation (DAC).
- Investors: Validate your investment hypotheses and evaluate valuation scenarios for Danaos Corporation (DAC).
- Analysts: Enhance your analysis efficiency with a ready-to-use, customizable DCF model tailored for Danaos Corporation (DAC).
- Small Business Owners: Understand how major public entities like Danaos Corporation (DAC) are assessed in the market.
What the Template Contains
- Comprehensive DCF Model: Editable template featuring detailed valuation calculations tailored for Danaos Corporation (DAC).
- Real-World Data: Danaos Corporation’s historical and projected financials preloaded for thorough analysis.
- Customizable Parameters: Modify WACC, growth rates, and tax assumptions to explore various scenarios.
- Financial Statements: Complete annual and quarterly breakdowns for enhanced insights into performance.
- Key Ratios: Integrated analysis for profitability, efficiency, and leverage metrics.
- Dashboard with Visual Outputs: Graphs and tables designed for clear, actionable results.
Disclaimer
All information, articles, and product details provided on this website are for general informational and educational purposes only. We do not claim any ownership over, nor do we intend to infringe upon, any trademarks, copyrights, logos, brand names, or other intellectual property mentioned or depicted on this site. Such intellectual property remains the property of its respective owners, and any references here are made solely for identification or informational purposes, without implying any affiliation, endorsement, or partnership.
We make no representations or warranties, express or implied, regarding the accuracy, completeness, or suitability of any content or products presented. Nothing on this website should be construed as legal, tax, investment, financial, medical, or other professional advice. In addition, no part of this site—including articles or product references—constitutes a solicitation, recommendation, endorsement, advertisement, or offer to buy or sell any securities, franchises, or other financial instruments, particularly in jurisdictions where such activity would be unlawful.
All content is of a general nature and may not address the specific circumstances of any individual or entity. It is not a substitute for professional advice or services. Any actions you take based on the information provided here are strictly at your own risk. You accept full responsibility for any decisions or outcomes arising from your use of this website and agree to release us from any liability in connection with your use of, or reliance upon, the content or products found herein.