
|
DoubleDown Interactive Co., Ltd. (DDI) DCF Avaliação |
Totalmente Editável: Adapte-Se Às Suas Necessidades No Excel Ou Planilhas
Design Profissional: Modelos Confiáveis E Padrão Da Indústria
Pré-Construídos Para Uso Rápido E Eficiente
Compatível com MAC/PC, totalmente desbloqueado
Não É Necessária Experiência; Fácil De Seguir
DoubleDown Interactive Co., Ltd. (DDI) Bundle
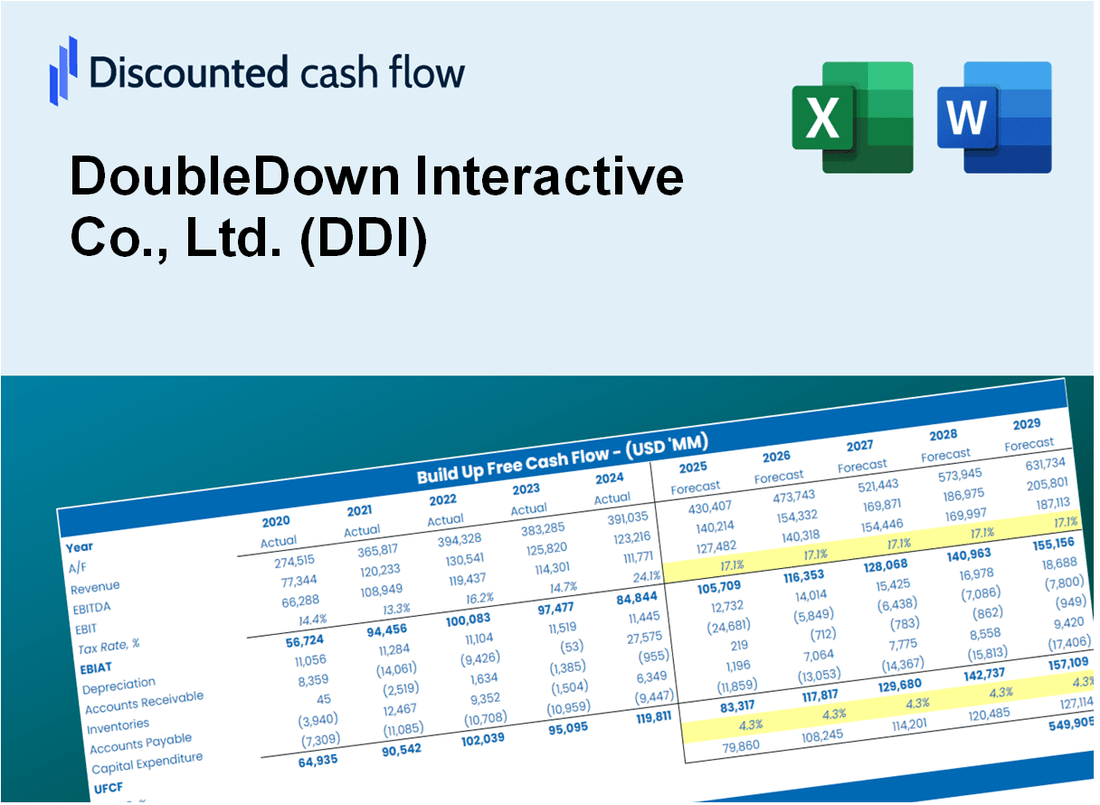
Obtenha informações sobre sua análise de avaliação da DoubleDown Interactive Co., Ltd. (DDI) com nossa poderosa calculadora DCF! Pré -carregado com dados reais (DDI), este modelo do Excel permite ajustar as previsões e suposições para determinar o valor intrínseco da DoubleDown Interactive Co., Ltd. com precisão.
Discounted Cash Flow (DCF) - (USD MM)
| Year | AY1 2020 |
AY2 2021 |
AY3 2022 |
AY4 2023 |
AY5 2024 |
FY1 2025 |
FY2 2026 |
FY3 2027 |
FY4 2028 |
FY5 2029 |
|---|---|---|---|---|---|---|---|---|---|---|
| Revenue | 358.3 | 363.2 | 321.0 | 308.9 | 341.3 | 338.3 | 335.3 | 332.4 | 329.4 | 326.5 |
| Revenue Growth, % | 0 | 1.36 | -11.61 | -3.79 | 10.51 | -0.88325 | -0.88325 | -0.88325 | -0.88325 | -0.88325 |
| EBITDA | 117.6 | 120.5 | -263.6 | 136.7 | 170.0 | 52.7 | 52.3 | 51.8 | 51.4 | 50.9 |
| EBITDA, % | 32.81 | 33.19 | -82.13 | 44.26 | 49.81 | 15.59 | 15.59 | 15.59 | 15.59 | 15.59 |
| Depreciation | 31.6 | 17.9 | 6.5 | 3.5 | 5.2 | 12.5 | 12.3 | 12.2 | 12.1 | 12.0 |
| Depreciation, % | 8.81 | 4.93 | 2.02 | 1.12 | 1.52 | 3.68 | 3.68 | 3.68 | 3.68 | 3.68 |
| EBIT | 86.0 | 102.6 | -270.1 | 133.3 | 164.8 | 40.3 | 39.9 | 39.6 | 39.2 | 38.9 |
| EBIT, % | 24 | 28.26 | -84.15 | 43.15 | 48.29 | 11.91 | 11.91 | 11.91 | 11.91 | 11.91 |
| Total Cash | 63.2 | 242.1 | 285.2 | 275.0 | 414.9 | 245.1 | 242.9 | 240.7 | 238.6 | 236.5 |
| Total Cash, percent | .0 | .0 | .0 | .0 | .0 | .0 | .0 | .0 | .0 | .0 |
| Account Receivables | 23.3 | 21.9 | 21.2 | 32.4 | 30.8 | 26.1 | 25.9 | 25.7 | 25.4 | 25.2 |
| Account Receivables, % | 6.5 | 6.02 | 6.6 | 10.48 | 9.02 | 7.72 | 7.72 | 7.72 | 7.72 | 7.72 |
| Inventories | .0 | .0 | .0 | .2 | .0 | .1 | .1 | .1 | .1 | .1 |
| Inventories, % | 0 | 0 | 0 | 0.08040723 | 0 | 0.01608145 | 0.01608145 | 0.01608145 | 0.01608145 | 0.01608145 |
| Accounts Payable | 16.6 | 14.8 | 13.8 | 13.3 | 2.9 | 12.3 | 12.2 | 12.1 | 12.0 | 11.9 |
| Accounts Payable, % | 4.65 | 4.06 | 4.31 | 4.3 | 0.84639 | 3.63 | 3.63 | 3.63 | 3.63 | 3.63 |
| Capital Expenditure | -.2 | -.3 | -.3 | -.2 | -.9 | -.4 | -.4 | -.4 | -.4 | -.4 |
| Capital Expenditure, % | -0.06223105 | -0.07378753 | -0.08503958 | -0.06410588 | -0.25869 | -0.10877 | -0.10877 | -0.10877 | -0.10877 | -0.10877 |
| Tax Rate, % | 23.86 | 23.86 | 23.86 | 23.86 | 23.86 | 23.86 | 23.86 | 23.86 | 23.86 | 23.86 |
| EBITAT | 61.3 | 79.7 | -207.1 | 102.5 | 125.5 | 30.5 | 30.2 | 30.0 | 29.7 | 29.4 |
| Depreciation | ||||||||||
| Changes in Account Receivables | ||||||||||
| Changes in Inventories | ||||||||||
| Changes in Accounts Payable | ||||||||||
| Capital Expenditure | ||||||||||
| UFCF | 86.0 | 96.8 | -201.1 | 93.8 | 121.2 | 56.6 | 42.3 | 42.0 | 41.6 | 41.2 |
| WACC, % | 7.71 | 7.71 | 7.71 | 7.71 | 7.71 | 7.71 | 7.71 | 7.71 | 7.71 | 7.71 |
| PV UFCF | ||||||||||
| SUM PV UFCF | 182.0 | |||||||||
| Long Term Growth Rate, % | 2.00 | |||||||||
| Free cash flow (T + 1) | 42 | |||||||||
| Terminal Value | 736 | |||||||||
| Present Terminal Value | 508 | |||||||||
| Enterprise Value | 690 | |||||||||
| Net Debt | -296 | |||||||||
| Equity Value | 986 | |||||||||
| Diluted Shares Outstanding, MM | 991 | |||||||||
| Equity Value Per Share | 0.99 |
What You Will Receive
- Pre-Filled Financial Model: DoubleDown Interactive's actual data facilitates accurate DCF valuation.
- Comprehensive Forecast Control: Modify revenue growth, profit margins, WACC, and other essential factors.
- Real-Time Calculations: Automatic updates provide immediate visibility of results as adjustments are made.
- Investor-Ready Template: A polished Excel file crafted for high-quality valuation.
- Customizable and Reusable: Designed for adaptability, allowing for repeated use in detailed forecasting.
Key Features
- Comprehensive DCF Calculator: Features detailed unlevered and levered DCF valuation models tailored for DoubleDown Interactive Co., Ltd. (DDI).
- WACC Calculator: Pre-designed Weighted Average Cost of Capital sheet with adjustable inputs specific to DDI.
- Customizable Forecast Assumptions: Adjust growth rates, capital expenditures, and discount rates to fit DDI's financial outlook.
- Integrated Financial Ratios: Evaluate profitability, leverage, and efficiency ratios relevant to DoubleDown Interactive Co., Ltd. (DDI).
- Interactive Dashboard and Charts: Visual representations provide a summary of key valuation metrics for straightforward analysis.
How It Works
- Download: Obtain the ready-to-use Excel file containing DoubleDown Interactive Co., Ltd.'s (DDI) financial data.
- Customize: Modify forecasts, including revenue growth, EBITDA %, and WACC.
- Update Automatically: The intrinsic value and NPV calculations refresh in real-time.
- Test Scenarios: Generate multiple projections and compare results instantly.
- Make Decisions: Utilize the valuation outcomes to inform your investment strategy.
Why Choose DoubleDown Interactive Co., Ltd. (DDI)?
- Save Time: Skip the lengthy setup – our solutions are ready for immediate use.
- Enhance Accuracy: Our dependable data and algorithms minimize valuation errors.
- Completely Customizable: Adjust our tools to align with your specific strategies and forecasts.
- User-Friendly: Intuitive visuals and outputs simplify the analysis process.
- Endorsed by Professionals: Crafted for experts who prioritize accuracy and functionality.
Who Should Use DoubleDown Interactive Co., Ltd. (DDI)?
- Game Developers: Leverage our platform to create engaging and innovative gaming experiences.
- Investors: Analyze market trends and performance metrics with our comprehensive analytics tools.
- Marketing Professionals: Utilize our resources to enhance user acquisition strategies and campaigns.
- Gaming Enthusiasts: Explore and enjoy a diverse range of casino-style games designed for fun and excitement.
- Educators and Students: Use our games as a case study for interactive learning in game design and business strategies.
What the Template Contains
- Operating and Balance Sheet Data: Pre-filled DoubleDown Interactive Co., Ltd. (DDI) historical data and forecasts, including revenue, EBITDA, EBIT, and capital expenditures.
- WACC Calculation: A dedicated sheet for Weighted Average Cost of Capital (WACC), including parameters like Beta, risk-free rate, and share price.
- DCF Valuation (Unlevered and Levered): Editable Discounted Cash Flow models showing intrinsic value with detailed calculations.
- Financial Statements: Pre-loaded financial statements (annual and quarterly) to support analysis.
- Key Ratios: Includes profitability, leverage, and efficiency ratios for DoubleDown Interactive Co., Ltd. (DDI).
- Dashboard and Charts: Visual summary of valuation outputs and assumptions to analyze results easily.
Disclaimer
All information, articles, and product details provided on this website are for general informational and educational purposes only. We do not claim any ownership over, nor do we intend to infringe upon, any trademarks, copyrights, logos, brand names, or other intellectual property mentioned or depicted on this site. Such intellectual property remains the property of its respective owners, and any references here are made solely for identification or informational purposes, without implying any affiliation, endorsement, or partnership.
We make no representations or warranties, express or implied, regarding the accuracy, completeness, or suitability of any content or products presented. Nothing on this website should be construed as legal, tax, investment, financial, medical, or other professional advice. In addition, no part of this site—including articles or product references—constitutes a solicitation, recommendation, endorsement, advertisement, or offer to buy or sell any securities, franchises, or other financial instruments, particularly in jurisdictions where such activity would be unlawful.
All content is of a general nature and may not address the specific circumstances of any individual or entity. It is not a substitute for professional advice or services. Any actions you take based on the information provided here are strictly at your own risk. You accept full responsibility for any decisions or outcomes arising from your use of this website and agree to release us from any liability in connection with your use of, or reliance upon, the content or products found herein.