
|
Denny's Corporation (Denn) DCF Avaliação |
Totalmente Editável: Adapte-Se Às Suas Necessidades No Excel Ou Planilhas
Design Profissional: Modelos Confiáveis E Padrão Da Indústria
Pré-Construídos Para Uso Rápido E Eficiente
Compatível com MAC/PC, totalmente desbloqueado
Não É Necessária Experiência; Fácil De Seguir
Denny's Corporation (DENN) Bundle
Aprimore suas opções de investimento com a calculadora DCF da Denny's Corporation (Denn)! Utilize os dados financeiros de Denny autênticos, ajuste as projeções e despesas de crescimento e observe instantaneamente como as modificações afetam o valor intrínseco da Corporação de Denny (Denn).
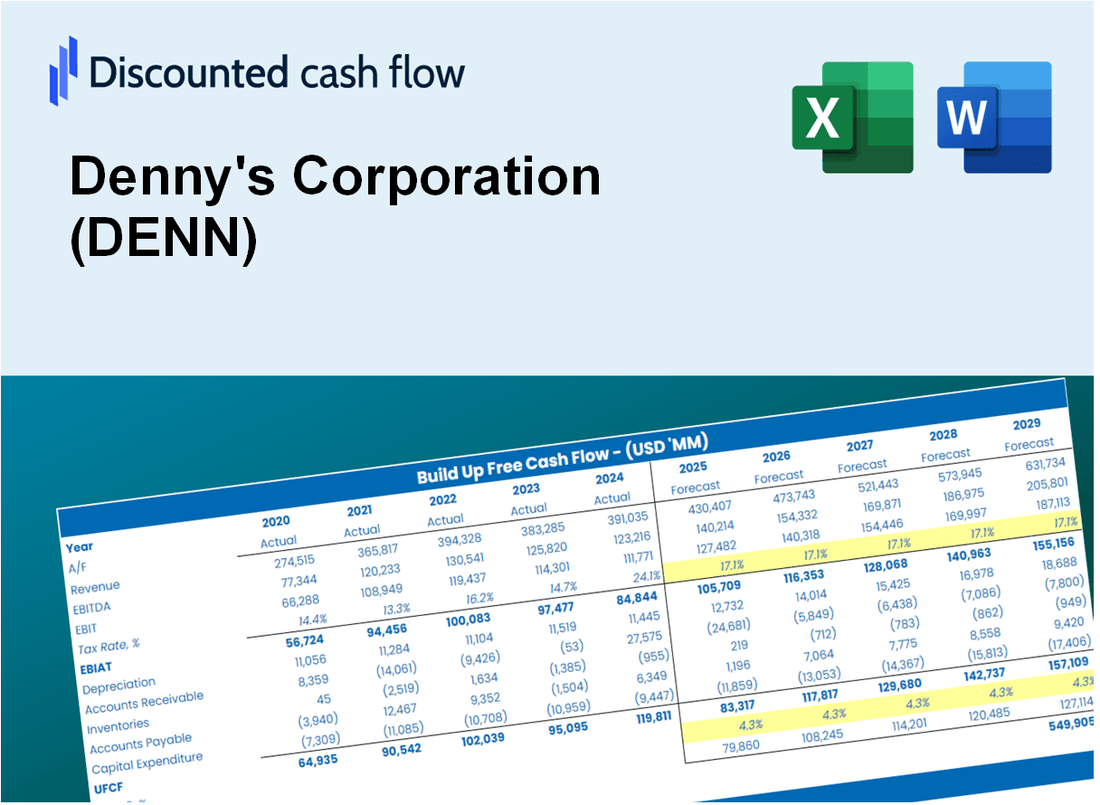
Discounted Cash Flow (DCF) - (USD MM)
| Year | AY1 2020 |
AY2 2021 |
AY3 2022 |
AY4 2023 |
AY5 2024 |
FY1 2025 |
FY2 2026 |
FY3 2027 |
FY4 2028 |
FY5 2029 |
|---|---|---|---|---|---|---|---|---|---|---|
| Revenue | 288.6 | 398.2 | 456.4 | 463.9 | 452.3 | 510.8 | 576.9 | 651.5 | 735.8 | 831.0 |
| Revenue Growth, % | 0 | 37.97 | 14.63 | 1.64 | -2.5 | 12.93 | 12.93 | 12.93 | 12.93 | 12.93 |
| EBITDA | 24.2 | 132.0 | 126.4 | 62.4 | 62.1 | 98.5 | 111.2 | 125.6 | 141.9 | 160.2 |
| EBITDA, % | 8.38 | 33.15 | 27.7 | 13.45 | 13.72 | 19.28 | 19.28 | 19.28 | 19.28 | 19.28 |
| Depreciation | 16.2 | 15.4 | 14.9 | 14.4 | 14.9 | 19.5 | 22.1 | 24.9 | 28.1 | 31.8 |
| Depreciation, % | 5.6 | 3.88 | 3.26 | 3.1 | 3.28 | 3.82 | 3.82 | 3.82 | 3.82 | 3.82 |
| EBIT | 8.0 | 116.6 | 111.6 | 48.0 | 47.2 | 79.0 | 89.2 | 100.7 | 113.7 | 128.5 |
| EBIT, % | 2.78 | 29.28 | 24.44 | 10.35 | 10.44 | 15.46 | 15.46 | 15.46 | 15.46 | 15.46 |
| Total Cash | 6.2 | 33.2 | 5.3 | 6.2 | 2.8 | 13.9 | 15.7 | 17.7 | 20.0 | 22.6 |
| Total Cash, percent | .0 | .0 | .0 | .0 | .0 | .0 | .0 | .0 | .0 | .0 |
| Account Receivables | 21.3 | 19.6 | 25.6 | 21.4 | 24.4 | 28.5 | 32.2 | 36.4 | 41.1 | 46.4 |
| Account Receivables, % | 7.4 | 4.93 | 5.6 | 4.61 | 5.4 | 5.59 | 5.59 | 5.59 | 5.59 | 5.59 |
| Inventories | 1.2 | 5.1 | 5.5 | 2.2 | 1.7 | 3.8 | 4.3 | 4.9 | 5.5 | 6.2 |
| Inventories, % | 0.40921 | 1.27 | 1.21 | 0.46883 | 0.38622 | 0.74968 | 0.74968 | 0.74968 | 0.74968 | 0.74968 |
| Accounts Payable | 12.0 | 15.6 | 19.9 | 24.1 | 20.0 | 22.5 | 25.4 | 28.7 | 32.4 | 36.6 |
| Accounts Payable, % | 4.17 | 3.92 | 4.36 | 5.19 | 4.42 | 4.41 | 4.41 | 4.41 | 4.41 | 4.41 |
| Capital Expenditure | -7.0 | -7.4 | -11.8 | -10.0 | -28.6 | -15.7 | -17.7 | -20.0 | -22.5 | -25.5 |
| Capital Expenditure, % | -2.41 | -1.85 | -2.59 | -2.15 | -6.32 | -3.06 | -3.06 | -3.06 | -3.06 | -3.06 |
| Tax Rate, % | 26.25 | 26.25 | 26.25 | 26.25 | 26.25 | 26.25 | 26.25 | 26.25 | 26.25 | 26.25 |
| EBITAT | 5.8 | 87.4 | 83.8 | 35.5 | 34.8 | 58.4 | 66.0 | 74.5 | 84.1 | 95.0 |
| Depreciation | ||||||||||
| Changes in Account Receivables | ||||||||||
| Changes in Inventories | ||||||||||
| Changes in Accounts Payable | ||||||||||
| Capital Expenditure | ||||||||||
| UFCF | 4.5 | 96.9 | 84.7 | 51.7 | 14.4 | 58.6 | 69.1 | 78.0 | 88.1 | 99.5 |
| WACC, % | 7.05 | 7.15 | 7.15 | 7.12 | 7.11 | 7.11 | 7.11 | 7.11 | 7.11 | 7.11 |
| PV UFCF | ||||||||||
| SUM PV UFCF | 315.9 | |||||||||
| Long Term Growth Rate, % | 0.50 | |||||||||
| Free cash flow (T + 1) | 100 | |||||||||
| Terminal Value | 1,512 | |||||||||
| Present Terminal Value | 1,072 | |||||||||
| Enterprise Value | 1,388 | |||||||||
| Net Debt | 406 | |||||||||
| Equity Value | 981 | |||||||||
| Diluted Shares Outstanding, MM | 53 | |||||||||
| Equity Value Per Share | 18.65 |
What You Will Get
- Real DENN Financial Data: Pre-filled with Denny's historical and projected data for precise analysis.
- Fully Editable Template: Modify key inputs like revenue growth, WACC, and EBITDA % with ease.
- Automatic Calculations: See Denny's intrinsic value update instantly based on your changes.
- Professional Valuation Tool: Designed for investors, analysts, and consultants seeking accurate DCF results.
- User-Friendly Design: Simple structure and clear instructions for all experience levels.
Key Features
- Comprehensive Financial Data: Denny's Corporation's historical financial statements and pre-filled projections.
- Customizable Parameters: Modify WACC, tax rates, revenue growth, and EBITDA margins to fit your analysis.
- Real-Time Valuation: Observe Denny's intrinsic value update instantly as you adjust inputs.
- Intuitive Visualizations: Dashboard charts showcase valuation outcomes and essential metrics clearly.
- Designed for Precision: A professional-grade tool tailored for analysts, investors, and finance professionals.
How It Works
- 1. Access the Template: Download and open the Excel file containing Denny's Corporation's (DEN) preloaded data.
- 2. Update Assumptions: Modify key inputs such as growth rates, WACC, and capital expenditures as needed.
- 3. Analyze Results Instantly: The DCF model automatically computes the intrinsic value and NPV for you.
- 4. Explore Scenarios: Evaluate various forecasts to assess different valuation outcomes.
- 5. Present with Assurance: Deliver professional valuation insights to back your strategic decisions.
Why Choose This Calculator for Denny's Corporation (DENN)?
- Designed for Experts: A sophisticated tool tailored for analysts, CFOs, and financial consultants.
- Accurate Financial Data: Denny's historical and projected financials are preloaded for precise calculations.
- Flexible Scenario Analysis: Easily simulate various forecasts and assumptions to explore different outcomes.
- Comprehensive Outputs: Automatically computes intrinsic value, NPV, and essential financial metrics.
- User-Friendly Interface: Step-by-step guidance ensures a smooth and straightforward experience.
Who Should Use This Product?
- Investors: Evaluate Denny's Corporation's (DEN) financial health before making investment decisions.
- CFOs and Financial Analysts: Enhance valuation methodologies and assess future earnings potential.
- Startup Founders: Understand the valuation strategies employed by established brands like Denny's.
- Consultants: Provide comprehensive valuation assessments for clients in the food service industry.
- Students and Educators: Utilize current market data to learn and teach valuation practices.
What the Template Contains
- Operating and Balance Sheet Data: Pre-filled Denny's Corporation (DENN) historical data and forecasts, including revenue, EBITDA, EBIT, and capital expenditures.
- WACC Calculation: A dedicated sheet for Weighted Average Cost of Capital (WACC), including parameters such as Beta, risk-free rate, and share price.
- DCF Valuation (Unlevered and Levered): Editable Discounted Cash Flow models demonstrating intrinsic value with detailed calculations.
- Financial Statements: Pre-loaded financial statements (annual and quarterly) to support analysis.
- Key Ratios: Includes profitability, leverage, and efficiency ratios for Denny's Corporation (DENN).
- Dashboard and Charts: Visual summary of valuation outputs and assumptions to facilitate easy analysis of results.
Disclaimer
All information, articles, and product details provided on this website are for general informational and educational purposes only. We do not claim any ownership over, nor do we intend to infringe upon, any trademarks, copyrights, logos, brand names, or other intellectual property mentioned or depicted on this site. Such intellectual property remains the property of its respective owners, and any references here are made solely for identification or informational purposes, without implying any affiliation, endorsement, or partnership.
We make no representations or warranties, express or implied, regarding the accuracy, completeness, or suitability of any content or products presented. Nothing on this website should be construed as legal, tax, investment, financial, medical, or other professional advice. In addition, no part of this site—including articles or product references—constitutes a solicitation, recommendation, endorsement, advertisement, or offer to buy or sell any securities, franchises, or other financial instruments, particularly in jurisdictions where such activity would be unlawful.
All content is of a general nature and may not address the specific circumstances of any individual or entity. It is not a substitute for professional advice or services. Any actions you take based on the information provided here are strictly at your own risk. You accept full responsibility for any decisions or outcomes arising from your use of this website and agree to release us from any liability in connection with your use of, or reliance upon, the content or products found herein.