
|
Devyani International Limited (devyani.ns) DCF Avaliação |
Totalmente Editável: Adapte-Se Às Suas Necessidades No Excel Ou Planilhas
Design Profissional: Modelos Confiáveis E Padrão Da Indústria
Pré-Construídos Para Uso Rápido E Eficiente
Compatível com MAC/PC, totalmente desbloqueado
Não É Necessária Experiência; Fácil De Seguir
Devyani International Limited (DEVYANI.NS) Bundle
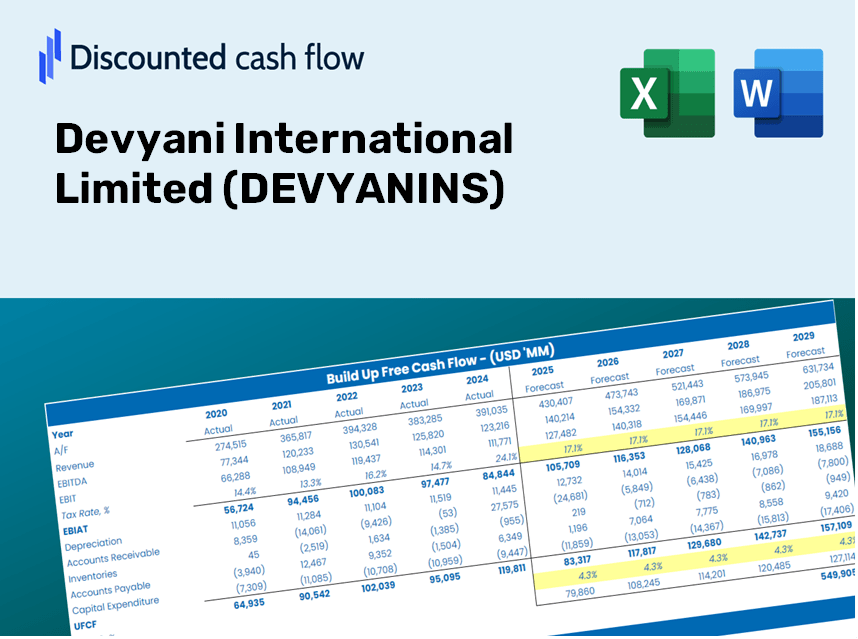
Avalie as perspectivas financeiras da Devyani International Limited (Devyanins) como um especialista! Esta calculadora DCF (Devyanins) fornece finanças pré-preenchidas e flexibilidade para modificar o crescimento da receita, o WACC, as margens e outras suposições cruciais para se alinhar às suas projeções.
Discounted Cash Flow (DCF) - (USD MM)
| Year | AY1 2021 |
AY2 2022 |
AY3 2023 |
AY4 2024 |
AY5 2025 |
FY1 2026 |
FY2 2027 |
FY3 2028 |
FY4 2029 |
FY5 2030 |
|---|---|---|---|---|---|---|---|---|---|---|
| Revenue | 11,348.4 | 20,840.1 | 29,728.0 | 35,316.8 | 49,206.4 | 71,892.5 | 105,037.8 | 153,464.3 | 224,217.5 | 327,590.6 |
| Revenue Growth, % | 0 | 83.64 | 42.65 | 18.8 | 39.33 | 46.1 | 46.1 | 46.1 | 46.1 | 46.1 |
| EBITDA | 2,935.1 | 4,671.1 | 6,635.2 | 5,749.4 | 8,422.0 | 14,952.5 | 21,846.2 | 31,918.2 | 46,633.7 | 68,133.7 |
| EBITDA, % | 25.86 | 22.41 | 22.32 | 16.28 | 17.12 | 20.8 | 20.8 | 20.8 | 20.8 | 20.8 |
| Depreciation | 2,246.4 | 2,213.3 | 2,753.3 | 3,822.9 | 5,698.8 | 8,926.6 | 13,042.0 | 19,054.9 | 27,840.0 | 40,675.4 |
| Depreciation, % | 19.79 | 10.62 | 9.26 | 10.82 | 11.58 | 12.42 | 12.42 | 12.42 | 12.42 | 12.42 |
| EBIT | 688.7 | 2,457.8 | 3,882.0 | 1,926.5 | 2,723.2 | 6,026.0 | 8,804.2 | 12,863.2 | 18,793.7 | 27,458.3 |
| EBIT, % | 6.07 | 11.79 | 13.06 | 5.45 | 5.53 | 8.38 | 8.38 | 8.38 | 8.38 | 8.38 |
| Total Cash | 399.7 | 1,495.1 | 841.1 | 1,912.0 | 1,813.7 | 3,253.1 | 4,753.0 | 6,944.3 | 10,145.9 | 14,823.5 |
| Total Cash, percent | .0 | .0 | .0 | .0 | .0 | .0 | .0 | .0 | .0 | .0 |
| Account Receivables | 178.8 | 605.3 | 303.5 | 552.4 | 413.1 | 1,136.6 | 1,660.6 | 2,426.2 | 3,544.8 | 5,179.1 |
| Account Receivables, % | 1.58 | 2.9 | 1.02 | 1.56 | 0.83953 | 1.58 | 1.58 | 1.58 | 1.58 | 1.58 |
| Inventories | 622.0 | 854.9 | 1,290.5 | 1,310.4 | 1,482.3 | 2,968.6 | 4,337.3 | 6,337.0 | 9,258.6 | 13,527.1 |
| Inventories, % | 5.48 | 4.1 | 4.34 | 3.71 | 3.01 | 4.13 | 4.13 | 4.13 | 4.13 | 4.13 |
| Accounts Payable | 1,619.0 | 1,963.7 | 2,419.0 | 3,756.4 | 4,411.4 | 7,394.5 | 10,803.6 | 15,784.5 | 23,061.8 | 33,694.2 |
| Accounts Payable, % | 14.27 | 9.42 | 8.14 | 10.64 | 8.97 | 10.29 | 10.29 | 10.29 | 10.29 | 10.29 |
| Capital Expenditure | -1,373.4 | -3,062.5 | -4,373.1 | -4,784.5 | -4,909.5 | -9,350.7 | -13,661.7 | -19,960.3 | -29,162.7 | -42,607.9 |
| Capital Expenditure, % | -12.1 | -14.7 | -14.71 | -13.55 | -9.98 | -13.01 | -13.01 | -13.01 | -13.01 | -13.01 |
| Tax Rate, % | 28.46 | 28.46 | 28.46 | 28.46 | 28.46 | 28.46 | 28.46 | 28.46 | 28.46 | 28.46 |
| EBITAT | 461.5 | 3,120.3 | 4,252.2 | 24,769.5 | 1,948.3 | 5,285.4 | 7,722.1 | 11,282.3 | 16,483.9 | 24,083.7 |
| Depreciation | ||||||||||
| Changes in Account Receivables | ||||||||||
| Changes in Inventories | ||||||||||
| Changes in Accounts Payable | ||||||||||
| Capital Expenditure | ||||||||||
| UFCF | 2,152.7 | 1,956.5 | 2,953.7 | 24,876.5 | 3,359.9 | 5,634.5 | 8,619.0 | 12,592.7 | 18,398.4 | 26,880.8 |
| WACC, % | 4.68 | 5.07 | 5.07 | 5.07 | 4.74 | 4.93 | 4.93 | 4.93 | 4.93 | 4.93 |
| PV UFCF | ||||||||||
| SUM PV UFCF | 60,413.7 | |||||||||
| Long Term Growth Rate, % | 4.00 | |||||||||
| Free cash flow (T + 1) | 27,956 | |||||||||
| Terminal Value | 3,017,037 | |||||||||
| Present Terminal Value | 2,372,207 | |||||||||
| Enterprise Value | 2,432,620 | |||||||||
| Net Debt | 30,062 | |||||||||
| Equity Value | 2,402,558 | |||||||||
| Diluted Shares Outstanding, MM | 1,144 | |||||||||
| Equity Value Per Share | 2,100.83 |
Benefits of Choosing DEVYANINS
- Authentic DEVYANINS Financial Data: Access historical and projected data for precise valuation.
- Customizable Parameters: Adjust WACC, tax rates, revenue growth, and capital expenditures as needed.
- Automated Calculations: Intrinsic value and NPV are calculated in real-time.
- Scenario Evaluation: Analyze various scenarios to assess the future performance of Devyani International Limited.
- User-Friendly Design: Designed for professionals while remaining accessible to newcomers.
Key Features of Devyani International Limited (DEVYANINS)
- Customizable Forecast Inputs: Adjust essential parameters such as revenue growth rates, EBITDA margins, and capital expenditures.
- Instant DCF Valuation: Quickly computes intrinsic value, NPV, and other financial outputs.
- High-Precision Accuracy: Incorporates Devyani's real financial data to deliver realistic valuation results.
- Effortless Scenario Analysis: Easily test various assumptions and evaluate different outcomes.
- Efficiency Booster: Streamlines the valuation process, removing the need for complex model development from scratch.
How It Works
- Step 1: Download the Excel file.
- Step 2: Review the pre-populated data for Devyani International Limited (DEVYANINS) (historical and projected).
- Step 3: Modify key assumptions (highlighted in yellow) based on your analysis.
- Step 4: Observe the automatic recalculations reflecting Devyani International Limited’s (DEVYANINS) intrinsic value.
- Step 5: Utilize the results for your investment strategies or reporting needs.
Why Choose the DCF Calculator for Devyani International Limited (DEVYANINS)?
- Time Efficient: Skip the hassle of building a DCF model from the ground up – our tool is ready for immediate use.
- Enhanced Accuracy: Trusted financial data and proven formulas minimize valuation errors.
- Completely Customizable: Adjust the model to align with your specific assumptions and forecasts.
- User-Friendly: Intuitive charts and outputs simplify result analysis.
- Endorsed by Professionals: Created for experts who prioritize accuracy and ease of use.
Who Should Use This Product?
- Individual Investors: Gain insights to make informed decisions about trading Devyani International Limited (DEVYANINS) stock.
- Financial Analysts: Enhance your valuation processes with comprehensive financial models tailored for Devyani International Limited (DEVYANINS).
- Consultants: Provide clients with accurate and timely valuation assessments of Devyani International Limited (DEVYANINS).
- Business Owners: Learn how major players like Devyani International Limited (DEVYANINS) are valued to inform your own business strategies.
- Finance Students: Master valuation techniques using real-world examples and data from Devyani International Limited (DEVYANINS).
Contents of the Template
- Operating and Balance Sheet Data: Pre-filled historical data and forecasts for Devyani International Limited (DEVYANINS), including revenue, EBITDA, EBIT, and capital expenditures.
- WACC Calculation: A dedicated section for calculating the Weighted Average Cost of Capital (WACC), incorporating parameters such as Beta, risk-free rate, and share price.
- DCF Valuation (Unlevered and Levered): Customizable Discounted Cash Flow models that present intrinsic value with comprehensive calculations.
- Financial Statements: Pre-loaded annual and quarterly financial statements to facilitate analysis.
- Key Ratios: Contains profitability, leverage, and efficiency ratios specific to Devyani International Limited (DEVYANINS).
- Dashboard and Charts: A visual summary of valuation outputs and underlying assumptions for easier result analysis.
Disclaimer
All information, articles, and product details provided on this website are for general informational and educational purposes only. We do not claim any ownership over, nor do we intend to infringe upon, any trademarks, copyrights, logos, brand names, or other intellectual property mentioned or depicted on this site. Such intellectual property remains the property of its respective owners, and any references here are made solely for identification or informational purposes, without implying any affiliation, endorsement, or partnership.
We make no representations or warranties, express or implied, regarding the accuracy, completeness, or suitability of any content or products presented. Nothing on this website should be construed as legal, tax, investment, financial, medical, or other professional advice. In addition, no part of this site—including articles or product references—constitutes a solicitation, recommendation, endorsement, advertisement, or offer to buy or sell any securities, franchises, or other financial instruments, particularly in jurisdictions where such activity would be unlawful.
All content is of a general nature and may not address the specific circumstances of any individual or entity. It is not a substitute for professional advice or services. Any actions you take based on the information provided here are strictly at your own risk. You accept full responsibility for any decisions or outcomes arising from your use of this website and agree to release us from any liability in connection with your use of, or reliance upon, the content or products found herein.