
|
Danaher Corporation (DHR) DCF Avaliação |
Totalmente Editável: Adapte-Se Às Suas Necessidades No Excel Ou Planilhas
Design Profissional: Modelos Confiáveis E Padrão Da Indústria
Pré-Construídos Para Uso Rápido E Eficiente
Compatível com MAC/PC, totalmente desbloqueado
Não É Necessária Experiência; Fácil De Seguir
Danaher Corporation (DHR) Bundle
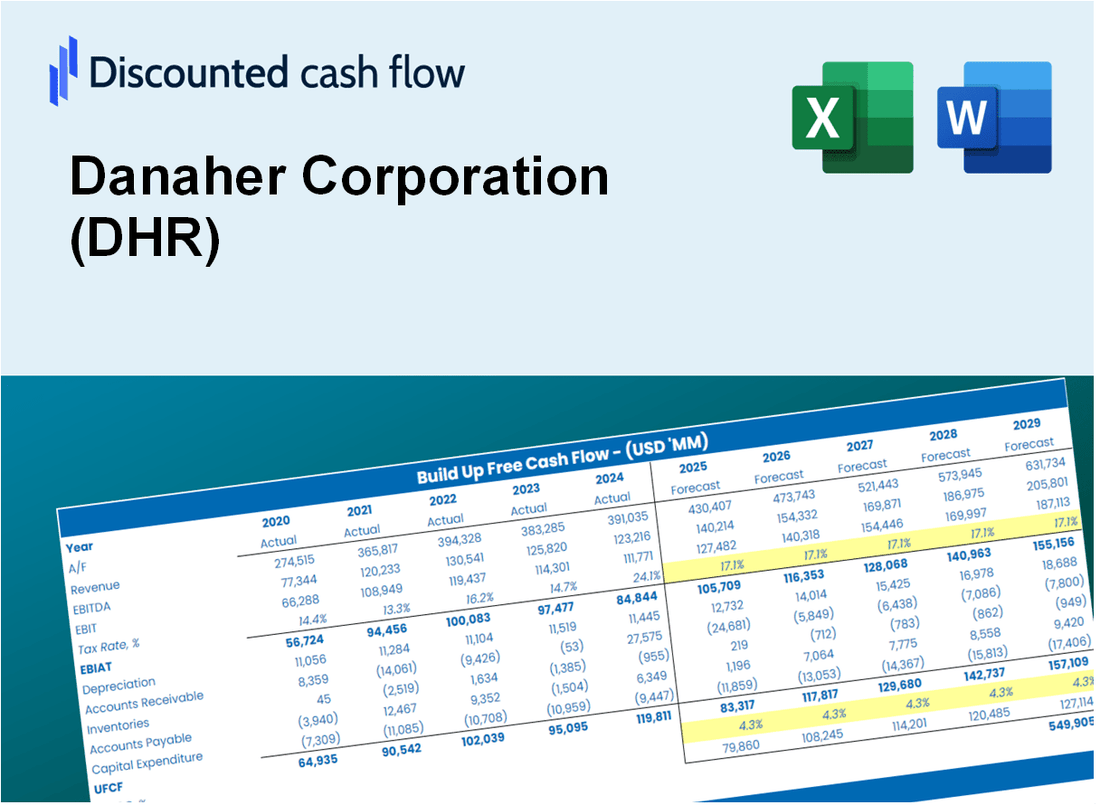
Avalie as perspectivas financeiras da Danaher Corporation (DHR) como um especialista! Esta calculadora DCF (DHR) vem com dados financeiros pré-preenchidos e permite que você controle total para modificar o crescimento da receita, o WACC, as margens e outras suposições cruciais para se alinhar com suas previsões.
What You Will Get
- Editable Excel Template: A fully customizable Excel-based DCF Calculator featuring pre-filled real DHR financials.
- Real-World Data: Historical data and forward-looking estimates (as indicated in the yellow cells).
- Forecast Flexibility: Adjust forecast assumptions such as revenue growth, EBITDA %, and WACC.
- Automatic Calculations: Instantly observe the effects of your inputs on Danaher Corporation's valuation.
- Professional Tool: Designed for investors, CFOs, consultants, and financial analysts.
- User-Friendly Design: Organized for clarity and ease of use, complete with step-by-step instructions.
Key Features
- Comprehensive Financial Data: Danaher Corporation’s historical financial statements and pre-filled projections.
- Customizable Parameters: Modify WACC, tax rates, revenue growth, and EBITDA margins as needed.
- Real-Time Valuation: Observe Danaher’s intrinsic value recalculating instantly.
- Intuitive Visualizations: Dashboard graphs showcase valuation outcomes and essential metrics.
- Designed for Precision: A professional-grade tool for analysts, investors, and finance professionals.
How It Works
- Step 1: Download the prebuilt Excel template containing Danaher Corporation’s (DHR) data.
- Step 2: Navigate through the pre-filled sheets to familiarize yourself with the essential metrics.
- Step 3: Modify forecasts and assumptions in the editable yellow cells (WACC, growth, margins).
- Step 4: Immediately see updated results, including Danaher Corporation’s (DHR) intrinsic value.
- Step 5: Use the outputs to make informed investment decisions or create detailed reports.
Why Choose This Calculator for Danaher Corporation (DHR)?
- Accurate Data: Utilize authentic Danaher financials for trustworthy valuation outcomes.
- Customizable: Tailor essential metrics such as growth rates, WACC, and tax rates to fit your forecasts.
- Time-Saving: Ready-to-use calculations save you the hassle of building from the ground up.
- Professional-Grade Tool: Crafted for investors, analysts, and consultants in the field.
- User-Friendly: Simple design and guided instructions make it accessible for all users.
Who Should Use This Product?
- Professional Investors: Create comprehensive and accurate valuation models for portfolio assessments of Danaher Corporation (DHR).
- Corporate Finance Teams: Evaluate valuation scenarios to inform strategic decisions within the company.
- Consultants and Advisors: Offer clients precise valuation insights for Danaher Corporation (DHR) stock.
- Students and Educators: Utilize real-world data to learn and teach financial modeling techniques.
- Industry Analysts: Gain insights into how companies like Danaher Corporation (DHR) are valued in the market.
What the Template Contains
- Comprehensive DCF Model: Editable template featuring detailed valuation calculations for Danaher Corporation (DHR).
- Real-World Data: Danaher’s historical and projected financials preloaded for in-depth analysis.
- Customizable Parameters: Adjust WACC, growth rates, and tax assumptions to explore various scenarios.
- Financial Statements: Complete annual and quarterly breakdowns for enhanced insights into performance.
- Key Ratios: Integrated analysis for assessing profitability, efficiency, and leverage metrics.
- Dashboard with Visual Outputs: Charts and tables designed for clear, actionable insights.
Disclaimer
All information, articles, and product details provided on this website are for general informational and educational purposes only. We do not claim any ownership over, nor do we intend to infringe upon, any trademarks, copyrights, logos, brand names, or other intellectual property mentioned or depicted on this site. Such intellectual property remains the property of its respective owners, and any references here are made solely for identification or informational purposes, without implying any affiliation, endorsement, or partnership.
We make no representations or warranties, express or implied, regarding the accuracy, completeness, or suitability of any content or products presented. Nothing on this website should be construed as legal, tax, investment, financial, medical, or other professional advice. In addition, no part of this site—including articles or product references—constitutes a solicitation, recommendation, endorsement, advertisement, or offer to buy or sell any securities, franchises, or other financial instruments, particularly in jurisdictions where such activity would be unlawful.
All content is of a general nature and may not address the specific circumstances of any individual or entity. It is not a substitute for professional advice or services. Any actions you take based on the information provided here are strictly at your own risk. You accept full responsibility for any decisions or outcomes arising from your use of this website and agree to release us from any liability in connection with your use of, or reliance upon, the content or products found herein.