
|
Diamond Power Infrastructure Limited (DIACABS.NS) Avaliação DCF |
Totalmente Editável: Adapte-Se Às Suas Necessidades No Excel Ou Planilhas
Design Profissional: Modelos Confiáveis E Padrão Da Indústria
Pré-Construídos Para Uso Rápido E Eficiente
Compatível com MAC/PC, totalmente desbloqueado
Não É Necessária Experiência; Fácil De Seguir
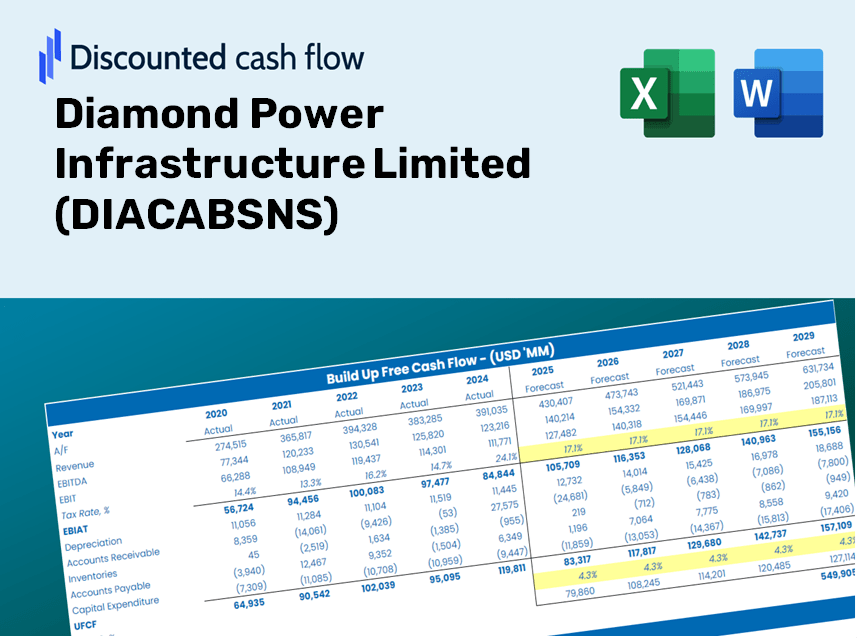
Diamond Power Infrastructure Limited (DIACABS.NS) Bundle
Procurando determinar o valor intrínseco da Infraestrutura de Power Diamond Limited? Nossa calculadora DCF (DIACABSNS) integra dados do mundo real com extensos recursos de personalização, permitindo ajustar as previsões e aprimorar suas opções de investimento.
Discounted Cash Flow (DCF) - (USD MM)
| Year | AY1 2021 |
AY2 2022 |
AY3 2023 |
AY4 2024 |
AY5 2025 |
FY1 2026 |
FY2 2027 |
FY3 2028 |
FY4 2029 |
FY5 2030 |
|---|---|---|---|---|---|---|---|---|---|---|
| Revenue | .6 | 157.4 | 154.6 | 3,433.7 | 11,153.9 | 19,468.5 | 33,981.2 | 59,312.2 | 103,526.1 | 180,698.9 |
| Revenue Growth, % | 0 | 27093.49 | -1.82 | 2121.55 | 224.84 | 74.54 | 74.54 | 74.54 | 74.54 | 74.54 |
| EBITDA | -21.8 | -27.8 | -234.4 | 428.7 | 673.3 | -7,753.8 | -13,533.8 | -23,622.5 | -41,231.7 | -71,967.5 |
| EBITDA, % | -3757.21 | -17.66 | -151.64 | 12.48 | 6.04 | -39.83 | -39.83 | -39.83 | -39.83 | -39.83 |
| Depreciation | 157.0 | 157.0 | 188.4 | 195.6 | 202.8 | 11,964.0 | 20,882.6 | 36,449.3 | 63,620.2 | 111,045.3 |
| Depreciation, % | 27125.78 | 99.75 | 121.87 | 5.7 | 1.82 | 61.45 | 61.45 | 61.45 | 61.45 | 61.45 |
| EBIT | -178.8 | -184.8 | -422.7 | 233.0 | 470.6 | -11,252.6 | -19,640.8 | -34,281.9 | -59,837.0 | -104,442.1 |
| EBIT, % | -30882.99 | -117.41 | -273.51 | 6.79 | 4.22 | -57.8 | -57.8 | -57.8 | -57.8 | -57.8 |
| Total Cash | -44.3 | 43.8 | 37.2 | 44.5 | 136.0 | -1,775.7 | -3,099.3 | -5,409.7 | -9,442.3 | -16,481.0 |
| Total Cash, percent | .0 | .0 | .0 | .0 | .0 | .0 | .0 | .0 | .0 | .0 |
| Account Receivables | 3,086.3 | 3,086.2 | 65.8 | 588.2 | 1,756.1 | 10,723.9 | 18,717.9 | 32,671.1 | 57,025.5 | 99,534.7 |
| Account Receivables, % | 533091.28 | 1960.34 | 42.54 | 17.13 | 15.74 | 55.08 | 55.08 | 55.08 | 55.08 | 55.08 |
| Inventories | 474.0 | 474.0 | 680.1 | 1,202.8 | 2,055.3 | 13,762.6 | 24,021.8 | 41,928.7 | 73,184.1 | 127,738.6 |
| Inventories, % | 81880.61 | 301.1 | 440.04 | 35.03 | 18.43 | 70.69 | 70.69 | 70.69 | 70.69 | 70.69 |
| Accounts Payable | 1,043.9 | 1,044.3 | 286.6 | 975.7 | 1,984.7 | 13,480.4 | 23,529.2 | 41,068.9 | 71,683.4 | 125,119.3 |
| Accounts Payable, % | 180319.43 | 663.35 | 185.45 | 28.42 | 17.79 | 69.24 | 69.24 | 69.24 | 69.24 | 69.24 |
| Capital Expenditure | .0 | .0 | -13.8 | -163.8 | -676.7 | -768.5 | -1,341.3 | -2,341.2 | -4,086.4 | -7,132.6 |
| Capital Expenditure, % | 0 | 0 | -8.9 | -4.77 | -6.07 | -3.95 | -3.95 | -3.95 | -3.95 | -3.95 |
| Tax Rate, % | -0.24904 | -0.24904 | -0.24904 | -0.24904 | -0.24904 | -0.24904 | -0.24904 | -0.24904 | -0.24904 | -0.24904 |
| EBITAT | -178.8 | -184.8 | -422.7 | 234.7 | 471.7 | -11,252.6 | -19,640.8 | -34,281.9 | -59,837.0 | -104,442.1 |
| Depreciation | ||||||||||
| Changes in Account Receivables | ||||||||||
| Changes in Inventories | ||||||||||
| Changes in Accounts Payable | ||||||||||
| Capital Expenditure | ||||||||||
| UFCF | -2,538.1 | -27.4 | 1,808.6 | -89.6 | -1,013.5 | -9,236.5 | -8,304.0 | -14,494.1 | -25,298.6 | -44,157.3 |
| WACC, % | 7.33 | 7.33 | 7.33 | 7.33 | 7.33 | 7.33 | 7.33 | 7.33 | 7.33 | 7.33 |
| PV UFCF | ||||||||||
| SUM PV UFCF | -77,610.5 | |||||||||
| Long Term Growth Rate, % | 2.00 | |||||||||
| Free cash flow (T + 1) | -45,040 | |||||||||
| Terminal Value | -845,462 | |||||||||
| Present Terminal Value | -593,667 | |||||||||
| Enterprise Value | -671,278 | |||||||||
| Net Debt | 4,555 | |||||||||
| Equity Value | -675,833 | |||||||||
| Diluted Shares Outstanding, MM | 523 | |||||||||
| Equity Value Per Share | -1,292.58 |
What You Will Receive
- Adjustable Forecast Inputs: Easily modify assumptions (growth %, margins, WACC) to generate various scenarios.
- Real-World Data: Diamond Power Infrastructure Limited’s financial information pre-filled to facilitate your analysis.
- Automated DCF Outputs: The template computes Net Present Value (NPV) and intrinsic value for you.
- Professional and Customizable: A sleek Excel model that aligns with your valuation requirements.
- Designed for Analysts and Investors: Perfect for evaluating projections, confirming strategies, and enhancing efficiency.
Key Features
- Comprehensive DIACABSNS Data: Includes detailed historical financial data and future projections for Diamond Power Infrastructure Limited.
- Fully Customizable Variables: Modify revenue growth rates, profit margins, WACC, tax rates, and capital expenditures according to your analysis.
- Dynamic Valuation Model: Instant updates to Net Present Value (NPV) and intrinsic value as per your adjustments.
- Scenario Analysis: Develop various forecast scenarios to assess different valuation results.
- User-Friendly Interface: Intuitive design that caters to both experienced professionals and newcomers.
How It Works
- Step 1: Download the Excel file.
- Step 2: Examine Diamond Power Infrastructure Limited's (DIACABSNS) pre-filled financial data and projections.
- Step 3: Adjust key inputs such as revenue growth, WACC, and tax rates (highlighted cells).
- Step 4: Observe the DCF model update in real-time as you modify the assumptions.
- Step 5: Evaluate the results and leverage the findings for your investment decisions.
Why Opt for This Calculator?
- All-in-One Solution: Features DCF, WACC, and financial ratio assessments in a single platform.
- Flexible Inputs: Modify the yellow-highlighted fields to explore different scenarios.
- In-Depth Analysis: Automatically computes the intrinsic value and Net Present Value for Diamond Power Infrastructure Limited (DIACABSNS).
- Preloaded Information: Historical and projected data provide reliable starting points.
- High-Quality Standards: Perfect for financial analysts, investors, and business consultants alike.
Who Should Utilize Diamond Power Infrastructure Limited (DIACABSNS)?
- Investors: Assess the valuation of Diamond Power Infrastructure Limited before making stock transactions.
- CFOs and Financial Analysts: Enhance valuation methodologies and evaluate financial forecasts.
- Startup Founders: Discover the valuation principles used for established public firms like Diamond Power Infrastructure Limited.
- Consultants: Provide expert valuation reports to your clients regarding DIACABSNS.
- Students and Educators: Utilize real market data to practice and teach valuation strategies.
Contents of the Template
- Comprehensive DCF Model: An editable template featuring thorough valuation calculations.
- Real-World Data: Preloaded historical and projected financials for Diamond Power Infrastructure Limited (DIACABSNS) for in-depth analysis.
- Customizable Parameters: Modify WACC, growth rates, and tax assumptions to explore various scenarios.
- Financial Statements: Complete annual and quarterly breakdowns for enhanced insights.
- Key Ratios: Integrated analysis for assessing profitability, efficiency, and leverage.
- Dashboard with Visual Outputs: Engaging charts and tables for clear, actionable insights.
Disclaimer
All information, articles, and product details provided on this website are for general informational and educational purposes only. We do not claim any ownership over, nor do we intend to infringe upon, any trademarks, copyrights, logos, brand names, or other intellectual property mentioned or depicted on this site. Such intellectual property remains the property of its respective owners, and any references here are made solely for identification or informational purposes, without implying any affiliation, endorsement, or partnership.
We make no representations or warranties, express or implied, regarding the accuracy, completeness, or suitability of any content or products presented. Nothing on this website should be construed as legal, tax, investment, financial, medical, or other professional advice. In addition, no part of this site—including articles or product references—constitutes a solicitation, recommendation, endorsement, advertisement, or offer to buy or sell any securities, franchises, or other financial instruments, particularly in jurisdictions where such activity would be unlawful.
All content is of a general nature and may not address the specific circumstances of any individual or entity. It is not a substitute for professional advice or services. Any actions you take based on the information provided here are strictly at your own risk. You accept full responsibility for any decisions or outcomes arising from your use of this website and agree to release us from any liability in connection with your use of, or reliance upon, the content or products found herein.