
|
Denali Therapeutics Inc. (DNLI) Avaliação DCF |
Totalmente Editável: Adapte-Se Às Suas Necessidades No Excel Ou Planilhas
Design Profissional: Modelos Confiáveis E Padrão Da Indústria
Pré-Construídos Para Uso Rápido E Eficiente
Compatível com MAC/PC, totalmente desbloqueado
Não É Necessária Experiência; Fácil De Seguir
Denali Therapeutics Inc. (DNLI) Bundle
Avalie as perspectivas financeiras Denali Therapeutics Inc. (DNLI) como um especialista! Essa calculadora DCF (DNLI) fornece dados financeiros pré-preenchidos e oferece flexibilidade para modificar o crescimento da receita, WACC, margens e outras suposições essenciais para se alinhar com suas previsões.
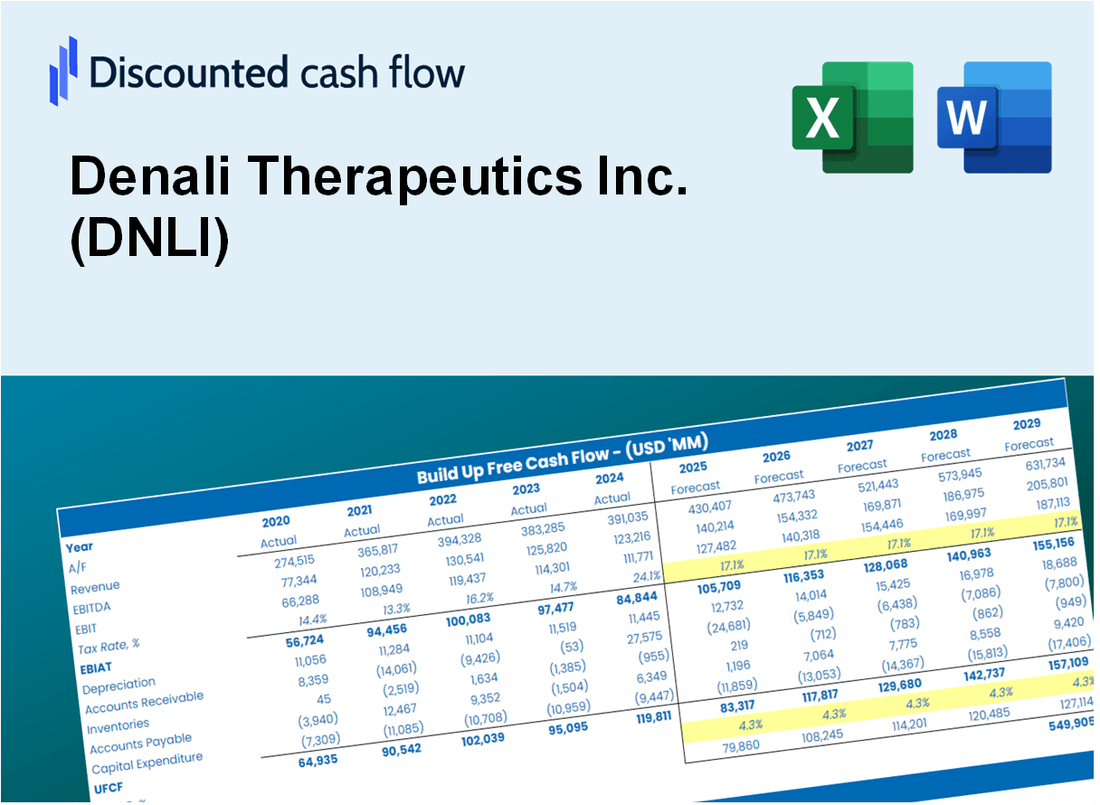
Discounted Cash Flow (DCF) - (USD MM)
| Year | AY1 2020 |
AY2 2021 |
AY3 2022 |
AY4 2023 |
AY5 2024 |
FY1 2025 |
FY2 2026 |
FY3 2027 |
FY4 2028 |
FY5 2029 |
|---|---|---|---|---|---|---|---|---|---|---|
| Revenue | 335.7 | 48.7 | 108.5 | 330.5 | .0 | .0 | .0 | .0 | .0 | .0 |
| Revenue Growth, % | 0 | -85.5 | 122.9 | 204.74 | -100 | 3.62 | 3.62 | 3.62 | 3.62 | 3.62 |
| EBITDA | 62.7 | -287.2 | -330.4 | -180.0 | -414.9 | .0 | .0 | .0 | .0 | .0 |
| EBITDA, % | 18.69 | -590.12 | -304.58 | -54.45 | 100 | -27.15 | -27.15 | -27.15 | -27.15 | -27.15 |
| Depreciation | 6.2 | 5.6 | 7.0 | 16.7 | 7.8 | .0 | .0 | .0 | .0 | .0 |
| Depreciation, % | 1.84 | 11.53 | 6.48 | 5.06 | 100 | 24.98 | 24.98 | 24.98 | 24.98 | 24.98 |
| EBIT | 56.5 | -292.8 | -337.4 | -196.7 | -422.7 | .0 | .0 | .0 | .0 | .0 |
| EBIT, % | 16.85 | -601.65 | -311.07 | -59.51 | 100 | -28.53 | -28.53 | -28.53 | -28.53 | -28.53 |
| Total Cash | 1,469.7 | 865.4 | 1,336.2 | 1,034.5 | 832.3 | .0 | .0 | .0 | .0 | .0 |
| Total Cash, percent | .0 | .0 | .0 | .0 | .0 | .0 | .0 | .0 | .0 | .0 |
| Account Receivables | .0 | 1.2 | 9.3 | 3.4 | 2.2 | .0 | .0 | .0 | .0 | .0 |
| Account Receivables, % | 0 | 2.52 | 8.56 | 1.03 | 100 | 22.42 | 22.42 | 22.42 | 22.42 | 22.42 |
| Inventories | .0 | .0 | -5.0 | .0 | .0 | .0 | .0 | .0 | .0 | .0 |
| Inventories, % | 0 | 0 | -4.61 | 0 | 100 | 19.08 | 19.08 | 19.08 | 19.08 | 19.08 |
| Accounts Payable | 1.1 | 4.8 | 2.8 | 9.5 | 11.1 | .0 | .0 | .0 | .0 | .0 |
| Accounts Payable, % | 0.31907 | 9.82 | 2.57 | 2.87 | 100 | 23.12 | 23.12 | 23.12 | 23.12 | 23.12 |
| Capital Expenditure | -3.1 | -8.5 | -17.8 | -12.9 | -15.9 | .0 | .0 | .0 | .0 | .0 |
| Capital Expenditure, % | -0.92207 | -17.47 | -16.44 | -3.91 | 100 | -7.75 | -7.75 | -7.75 | -7.75 | -7.75 |
| Tax Rate, % | -0.01608687 | -0.01608687 | -0.01608687 | -0.01608687 | -0.01608687 | -0.01608687 | -0.01608687 | -0.01608687 | -0.01608687 | -0.01608687 |
| EBITAT | 55.9 | -292.2 | -337.4 | -196.7 | -422.8 | .0 | .0 | .0 | .0 | .0 |
| Depreciation | ||||||||||
| Changes in Account Receivables | ||||||||||
| Changes in Inventories | ||||||||||
| Changes in Accounts Payable | ||||||||||
| Capital Expenditure | ||||||||||
| UFCF | 60.0 | -292.6 | -353.3 | -185.4 | -428.0 | -9.0 | .0 | .0 | .0 | .0 |
| WACC, % | 9.71 | 9.71 | 9.71 | 9.71 | 9.71 | 9.71 | 9.71 | 9.71 | 9.71 | 9.71 |
| PV UFCF | ||||||||||
| SUM PV UFCF | -8.2 | |||||||||
| Long Term Growth Rate, % | 2.00 | |||||||||
| Free cash flow (T + 1) | 0 | |||||||||
| Terminal Value | 0 | |||||||||
| Present Terminal Value | 0 | |||||||||
| Enterprise Value | -8 | |||||||||
| Net Debt | -126 | |||||||||
| Equity Value | 118 | |||||||||
| Diluted Shares Outstanding, MM | 164 | |||||||||
| Equity Value Per Share | 0.72 |
What You Will Get
- Editable Forecast Inputs: Easily modify assumptions (growth %, margins, WACC) to explore various scenarios.
- Real-World Data: Denali Therapeutics Inc. (DNLI)’s financial data pre-filled to accelerate your analysis.
- Automatic DCF Outputs: The template computes Net Present Value (NPV) and intrinsic value for you.
- Customizable and Professional: A refined Excel model that adjusts to your valuation requirements.
- Built for Analysts and Investors: Perfect for evaluating projections, confirming strategies, and enhancing efficiency.
Key Features
- Comprehensive Data: Denali Therapeutics Inc.'s (DNLI) historical financial statements and pre-filled projections.
- Customizable Parameters: Adjust WACC, tax rates, revenue growth, and EBITDA margins to fit your analysis.
- Real-Time Insights: Instantly view Denali's intrinsic value recalculating as inputs change.
- Intuitive Visuals: Dashboard graphs showcase valuation results and important metrics clearly.
- Designed for Precision: A professional-grade tool tailored for analysts, investors, and finance professionals.
How It Works
- Step 1: Download the prebuilt Excel template featuring Denali Therapeutics Inc.'s (DNLI) data.
- Step 2: Navigate through the pre-filled sheets to grasp the essential metrics.
- Step 3: Modify forecasts and assumptions in the editable yellow cells (WACC, growth, margins).
- Step 4: Instantly see recalculated results, including Denali Therapeutics Inc.'s (DNLI) intrinsic value.
- Step 5: Make well-informed investment decisions or create reports based on the outputs.
Why Choose This Calculator for Denali Therapeutics Inc. (DNLI)?
- Comprehensive Tool: Features DCF, WACC, and in-depth financial ratio analyses all in one platform.
- Customizable Inputs: Modify the highlighted cells to explore different financial scenarios.
- Detailed Insights: Automatically computes Denali Therapeutics' intrinsic value and Net Present Value.
- Preloaded Data: Access to historical and projected data for precise analysis.
- Professional Quality: Perfect for financial analysts, investors, and consultants in the biotech sector.
Who Should Use This Product?
- Individual Investors: Make informed decisions about buying or selling Denali Therapeutics Inc. (DNLI) stock.
- Financial Analysts: Streamline valuation processes with ready-to-use financial models for Denali Therapeutics Inc. (DNLI).
- Consultants: Deliver professional valuation insights on Denali Therapeutics Inc. (DNLI) to clients quickly and accurately.
- Business Owners: Understand how biotech companies like Denali Therapeutics Inc. (DNLI) are valued to guide your own strategy.
- Finance Students: Learn valuation techniques using real-world data and scenarios related to Denali Therapeutics Inc. (DNLI).
What the Template Contains
- Comprehensive DCF Model: Editable template featuring intricate valuation calculations.
- Real-World Data: Denali Therapeutics Inc.'s (DNLI) historical and projected financials preloaded for thorough analysis.
- Customizable Parameters: Modify WACC, growth rates, and tax assumptions to explore different scenarios.
- Financial Statements: Complete annual and quarterly breakdowns for enhanced insights.
- Key Ratios: Integrated analysis for profitability, efficiency, and leverage metrics.
- Dashboard with Visual Outputs: Charts and tables providing clear, actionable results.
Disclaimer
All information, articles, and product details provided on this website are for general informational and educational purposes only. We do not claim any ownership over, nor do we intend to infringe upon, any trademarks, copyrights, logos, brand names, or other intellectual property mentioned or depicted on this site. Such intellectual property remains the property of its respective owners, and any references here are made solely for identification or informational purposes, without implying any affiliation, endorsement, or partnership.
We make no representations or warranties, express or implied, regarding the accuracy, completeness, or suitability of any content or products presented. Nothing on this website should be construed as legal, tax, investment, financial, medical, or other professional advice. In addition, no part of this site—including articles or product references—constitutes a solicitation, recommendation, endorsement, advertisement, or offer to buy or sell any securities, franchises, or other financial instruments, particularly in jurisdictions where such activity would be unlawful.
All content is of a general nature and may not address the specific circumstances of any individual or entity. It is not a substitute for professional advice or services. Any actions you take based on the information provided here are strictly at your own risk. You accept full responsibility for any decisions or outcomes arising from your use of this website and agree to release us from any liability in connection with your use of, or reliance upon, the content or products found herein.