
|
Doms Industries Limited (DOMS.NS) Avaliação DCF |
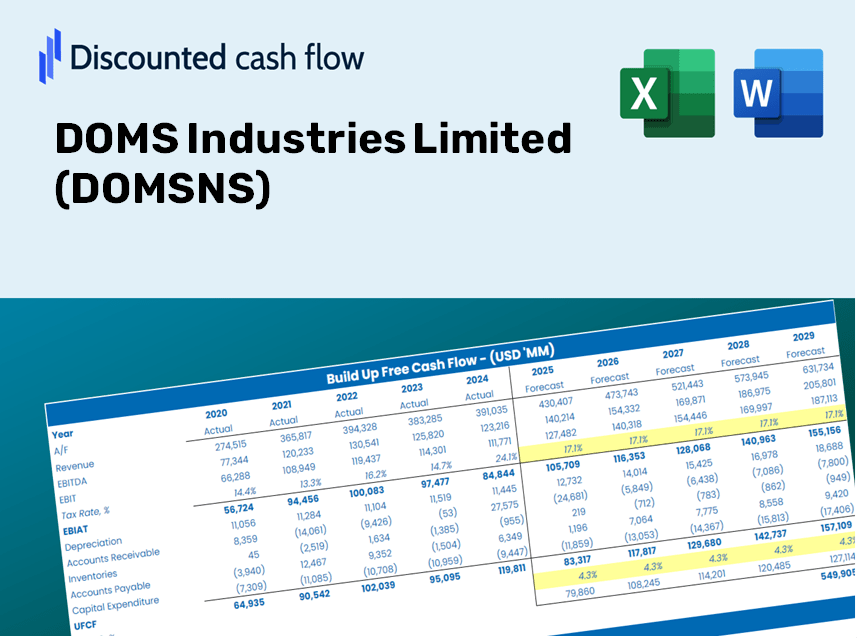
Totalmente Editável: Adapte-Se Às Suas Necessidades No Excel Ou Planilhas
Design Profissional: Modelos Confiáveis E Padrão Da Indústria
Pré-Construídos Para Uso Rápido E Eficiente
Compatível com MAC/PC, totalmente desbloqueado
Não É Necessária Experiência; Fácil De Seguir
Doms Industries Limited (DOMS.NS) Bundle
Seja você um investidor ou analista, essa calculadora DCF DOMSNS é sua ferramenta preferida para uma avaliação precisa. Pré -carregado com dados reais limitados da Doms Industries, você pode ajustar as previsões e observar instantaneamente os efeitos.
Discounted Cash Flow (DCF) - (USD MM)
| Year | AY1 2021 |
AY2 2022 |
AY3 2023 |
AY4 2024 |
AY5 2025 |
FY1 2026 |
FY2 2027 |
FY3 2028 |
FY4 2029 |
FY5 2030 |
|---|---|---|---|---|---|---|---|---|---|---|
| Revenue | 4,003.6 | 6,804.2 | 12,118.9 | 15,371.4 | 19,126.3 | 28,657.3 | 42,937.7 | 64,334.4 | 96,393.5 | 144,428.1 |
| Revenue Growth, % | 0 | 69.95 | 78.11 | 26.84 | 24.43 | 49.83 | 49.83 | 49.83 | 49.83 | 49.83 |
| EBITDA | 360.0 | 723.4 | 1,912.9 | 2,828.6 | 3,484.5 | 4,128.2 | 6,185.3 | 9,267.6 | 13,885.8 | 20,805.4 |
| EBITDA, % | 8.99 | 10.63 | 15.78 | 18.4 | 18.22 | 14.41 | 14.41 | 14.41 | 14.41 | 14.41 |
| Depreciation | 347.7 | 380.1 | 406.5 | 512.4 | 691.8 | 1,408.5 | 2,110.5 | 3,162.1 | 4,737.9 | 7,098.9 |
| Depreciation, % | 8.68 | 5.59 | 3.35 | 3.33 | 3.62 | 4.92 | 4.92 | 4.92 | 4.92 | 4.92 |
| EBIT | 12.3 | 343.2 | 1,506.4 | 2,316.2 | 2,792.7 | 2,719.6 | 4,074.9 | 6,105.5 | 9,147.9 | 13,706.5 |
| EBIT, % | 0.30647 | 5.04 | 12.43 | 15.07 | 14.6 | 9.49 | 9.49 | 9.49 | 9.49 | 9.49 |
| Total Cash | 283.3 | 150.6 | 409.3 | 3,041.0 | 2,253.7 | 2,535.3 | 3,798.6 | 5,691.6 | 8,527.8 | 12,777.3 |
| Total Cash, percent | .0 | .0 | .0 | .0 | .0 | .0 | .0 | .0 | .0 | .0 |
| Account Receivables | 424.9 | 503.3 | 367.0 | 646.5 | 1,362.1 | 1,855.0 | 2,779.4 | 4,164.5 | 6,239.7 | 9,349.1 |
| Account Receivables, % | 10.61 | 7.4 | 3.03 | 4.21 | 7.12 | 6.47 | 6.47 | 6.47 | 6.47 | 6.47 |
| Inventories | 1,207.8 | 1,591.9 | 1,846.4 | 2,251.0 | 2,940.4 | 5,663.7 | 8,486.0 | 12,714.7 | 19,050.7 | 28,544.0 |
| Inventories, % | 30.17 | 23.4 | 15.24 | 14.64 | 15.37 | 19.76 | 19.76 | 19.76 | 19.76 | 19.76 |
| Accounts Payable | 811.3 | 811.3 | 869.9 | 904.4 | 1,091.1 | 2,920.4 | 4,375.7 | 6,556.2 | 9,823.2 | 14,718.3 |
| Accounts Payable, % | 20.26 | 11.92 | 7.18 | 5.88 | 5.7 | 10.19 | 10.19 | 10.19 | 10.19 | 10.19 |
| Capital Expenditure | -230.2 | -348.9 | -1,362.9 | -1,534.6 | -2,132.7 | -2,479.3 | -3,714.8 | -5,565.9 | -8,339.5 | -12,495.3 |
| Capital Expenditure, % | -5.75 | -5.13 | -11.25 | -9.98 | -11.15 | -8.65 | -8.65 | -8.65 | -8.65 | -8.65 |
| Tax Rate, % | 29.46 | 29.46 | 29.46 | 29.46 | 29.46 | 29.46 | 29.46 | 29.46 | 29.46 | 29.46 |
| EBITAT | 14.6 | 205.2 | 1,040.1 | 1,653.8 | 1,970.1 | 2,016.7 | 3,021.7 | 4,527.4 | 6,783.5 | 10,163.9 |
| Depreciation | ||||||||||
| Changes in Account Receivables | ||||||||||
| Changes in Inventories | ||||||||||
| Changes in Accounts Payable | ||||||||||
| Capital Expenditure | ||||||||||
| UFCF | -689.3 | -226.2 | 24.1 | -18.0 | -689.1 | -441.0 | -874.1 | -1,309.6 | -1,962.3 | -2,940.1 |
| WACC, % | 8.49 | 8.45 | 8.46 | 8.47 | 8.46 | 8.47 | 8.47 | 8.47 | 8.47 | 8.47 |
| PV UFCF | ||||||||||
| SUM PV UFCF | -5,551.5 | |||||||||
| Long Term Growth Rate, % | 2.00 | |||||||||
| Free cash flow (T + 1) | -2,999 | |||||||||
| Terminal Value | -46,363 | |||||||||
| Present Terminal Value | -30,879 | |||||||||
| Enterprise Value | -36,430 | |||||||||
| Net Debt | -136 | |||||||||
| Equity Value | -36,294 | |||||||||
| Diluted Shares Outstanding, MM | 61 | |||||||||
| Equity Value Per Share | -597.49 |
What You Will Receive
- Flexible Forecast Inputs: Effortlessly adjust key assumptions (growth %, margins, WACC) to develop various scenarios.
- Industry-Specific Data: DOMS Industries Limited’s financial data pre-loaded to expedite your analysis.
- Automated DCF Calculations: The template computes Net Present Value (NPV) and intrinsic value for you.
- Customizable & Professional Design: A sleek Excel model tailored to meet your valuation requirements.
- Designed for Analysts and Investors: Perfect for evaluating forecasts, verifying strategies, and enhancing efficiency.
Highlighted Features
- Customizable Forecast Inputs: Adjust essential factors such as revenue growth, EBITDA margin, and capital expenditures.
- Instant DCF Valuation: Provides quick calculations for intrinsic value, NPV, and various financial outputs.
- High Precision Results: Relies on DOMS Industries Limited's actual financial data for accurate valuation insights.
- Simplified Scenario Evaluation: Effortlessly examine different assumptions and review outcomes side-by-side.
- Efficiency Booster: Avoid the hassle of creating intricate valuation models from the ground up.
How It Functions
- 1. Access the Template: Download and open the Excel file containing DOMS Industries Limited’s preloaded data.
- 2. Adjust Assumptions: Modify key variables such as growth rates, WACC, and capital expenditures to fit your analysis.
- 3. View Immediate Results: The DCF model automatically computes intrinsic value and NPV based on your inputs.
- 4. Explore Scenarios: Evaluate various forecasts to examine different valuation possibilities.
- 5. Present with Assurance: Deliver professional valuation insights that bolster your decision-making process.
Why Choose This Calculator for DOMS Industries Limited (DOMSNS)?
- Reliable Data: Authentic financial information from DOMS Industries guarantees trustworthy valuation outcomes.
- Customizable Options: Tailor essential variables such as growth rates, WACC, and tax rates to align with your forecasts.
- Efficiency Boost: Ready-to-use calculations save you the hassle of starting from the ground up.
- Expert-Level Tool: Crafted for investors, analysts, and consultants seeking precision.
- Easy to Use: A user-friendly interface and comprehensive guidance make it accessible for everyone.
Who Can Benefit from DOMS Industries Limited (DOMSNS)?
- Investors: Leverage our expert insights to make informed investment choices.
- Financial Analysts: Streamline your workflow with customizable tools tailored for in-depth analysis.
- Consultants: Effortlessly modify our resources for impactful client presentations and reports.
- Finance Enthusiasts: Enhance your knowledge of industry practices through practical, real-world applications.
- Educators and Students: Utilize our resources as valuable learning aids in finance-related subjects.
Contents of the Template
- Pre-Filled DCF Model: DOMS Industries Limited’s (DOMSNS) financial data ready for immediate application.
- WACC Calculator: Comprehensive calculations for Weighted Average Cost of Capital.
- Financial Ratios: Assess DOMSNS's profitability, leverage, and operational efficiency.
- Editable Inputs: Adjust assumptions such as growth rates, margins, and CAPEX to suit your analysis.
- Financial Statements: Annual and quarterly reports available for in-depth examination.
- Interactive Dashboard: Effortlessly visualize essential valuation metrics and outcomes.
Disclaimer
All information, articles, and product details provided on this website are for general informational and educational purposes only. We do not claim any ownership over, nor do we intend to infringe upon, any trademarks, copyrights, logos, brand names, or other intellectual property mentioned or depicted on this site. Such intellectual property remains the property of its respective owners, and any references here are made solely for identification or informational purposes, without implying any affiliation, endorsement, or partnership.
We make no representations or warranties, express or implied, regarding the accuracy, completeness, or suitability of any content or products presented. Nothing on this website should be construed as legal, tax, investment, financial, medical, or other professional advice. In addition, no part of this site—including articles or product references—constitutes a solicitation, recommendation, endorsement, advertisement, or offer to buy or sell any securities, franchises, or other financial instruments, particularly in jurisdictions where such activity would be unlawful.
All content is of a general nature and may not address the specific circumstances of any individual or entity. It is not a substitute for professional advice or services. Any actions you take based on the information provided here are strictly at your own risk. You accept full responsibility for any decisions or outcomes arising from your use of this website and agree to release us from any liability in connection with your use of, or reliance upon, the content or products found herein.