
|
Avaliação DCF da Corporação de Armazenamento de Dados (DTST) |
Totalmente Editável: Adapte-Se Às Suas Necessidades No Excel Ou Planilhas
Design Profissional: Modelos Confiáveis E Padrão Da Indústria
Pré-Construídos Para Uso Rápido E Eficiente
Compatível com MAC/PC, totalmente desbloqueado
Não É Necessária Experiência; Fácil De Seguir
Data Storage Corporation (DTST) Bundle
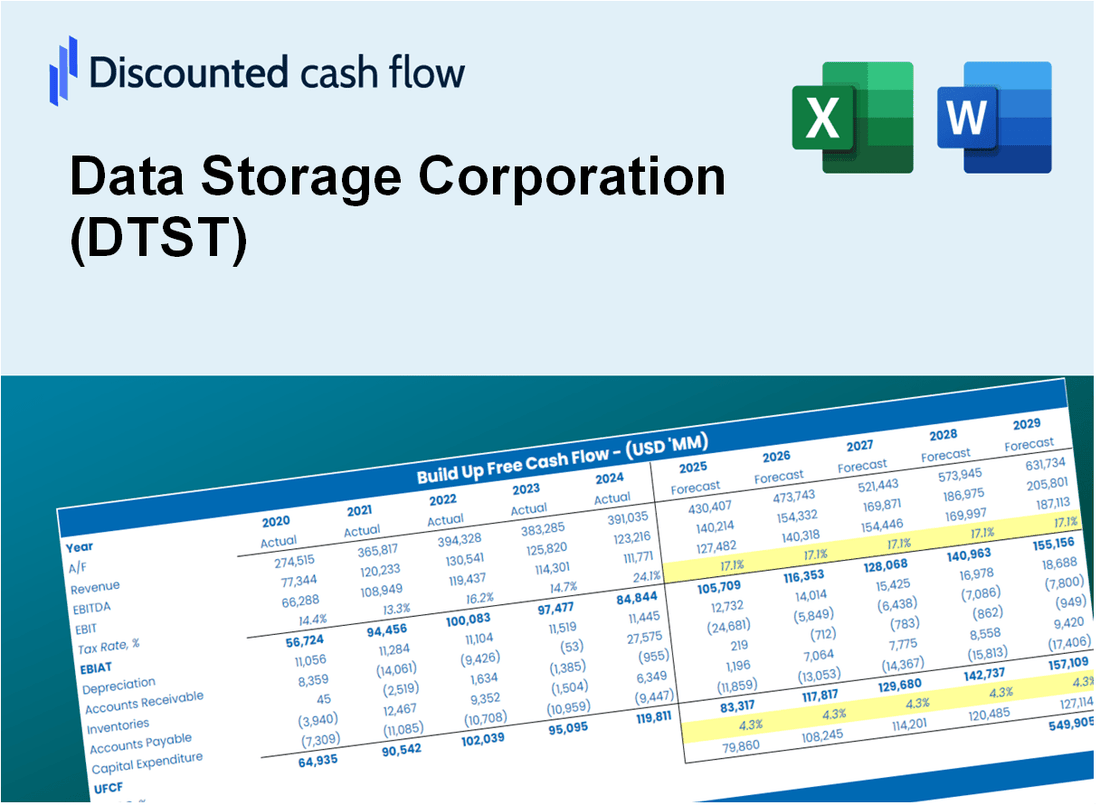
Obtenha uma visão da análise de avaliação da sua corporação de armazenamento de dados (DTST) com nossa calculadora DCF de última geração! Pré -carregado com dados reais (DTST), este modelo Excel o capacita a ajustar as previsões e suposições para calcular com precisão o valor intrínseco da Corporação de Armazenamento de Dados.
Discounted Cash Flow (DCF) - (USD MM)
| Year | AY1 2020 |
AY2 2021 |
AY3 2022 |
AY4 2023 |
AY5 2024 |
FY1 2025 |
FY2 2026 |
FY3 2027 |
FY4 2028 |
FY5 2029 |
|---|---|---|---|---|---|---|---|---|---|---|
| Revenue | 9.3 | 14.9 | 23.9 | 25.0 | 25.4 | 33.4 | 43.9 | 57.8 | 76.0 | 100.0 |
| Revenue Growth, % | 0 | 59.6 | 60.46 | 4.56 | 1.65 | 31.57 | 31.57 | 31.57 | 31.57 | 31.57 |
| EBITDA | 1.5 | 1.3 | -2.9 | 1.7 | 2.1 | 1.8 | 2.4 | 3.2 | 4.2 | 5.5 |
| EBITDA, % | 15.91 | 8.55 | -11.95 | 6.71 | 8.33 | 5.51 | 5.51 | 5.51 | 5.51 | 5.51 |
| Depreciation | 1.1 | 1.3 | 1.4 | 1.3 | 1.4 | 2.5 | 3.3 | 4.4 | 5.7 | 7.5 |
| Depreciation, % | 12.17 | 8.63 | 5.98 | 5.21 | 5.68 | 7.53 | 7.53 | 7.53 | 7.53 | 7.53 |
| EBIT | .3 | .0 | -4.3 | .4 | .7 | -.7 | -.9 | -1.2 | -1.5 | -2.0 |
| EBIT, % | 3.74 | -0.08714575 | -17.92 | 1.5 | 2.65 | -2.03 | -2.03 | -2.03 | -2.03 | -2.03 |
| Total Cash | .9 | 12.1 | 11.3 | 12.7 | 12.3 | 15.9 | 20.9 | 27.5 | 36.2 | 47.6 |
| Total Cash, percent | .0 | .0 | .0 | .0 | .0 | .0 | .0 | .0 | .0 | .0 |
| Account Receivables | .6 | 2.4 | 3.5 | 1.3 | 2.2 | 3.4 | 4.4 | 5.8 | 7.7 | 10.1 |
| Account Receivables, % | 5.95 | 16.03 | 14.67 | 5.05 | 8.77 | 10.09 | 10.09 | 10.09 | 10.09 | 10.09 |
| Inventories | .0 | .0 | .5 | .0 | .0 | .2 | .2 | .3 | .3 | .5 |
| Inventories, % | 0 | 0 | 2.28 | 0 | 0 | 0.45523 | 0.45523 | 0.45523 | 0.45523 | 0.45523 |
| Accounts Payable | 1.0 | 1.3 | 3.2 | 2.6 | 3.2 | 3.7 | 4.9 | 6.5 | 8.5 | 11.2 |
| Accounts Payable, % | 10.51 | 9.03 | 13.44 | 10.45 | 12.55 | 11.2 | 11.2 | 11.2 | 11.2 | 11.2 |
| Capital Expenditure | -.2 | -.5 | -.1 | -1.5 | -1.8 | -1.3 | -1.7 | -2.2 | -2.9 | -3.8 |
| Capital Expenditure, % | -1.94 | -3.06 | -0.53311 | -6.19 | -7.1 | -3.77 | -3.77 | -3.77 | -3.77 | -3.77 |
| Tax Rate, % | 5.23 | 5.23 | 5.23 | 5.23 | 5.23 | 5.23 | 5.23 | 5.23 | 5.23 | 5.23 |
| EBITAT | -.7 | .0 | -4.2 | .5 | .6 | -.4 | -.5 | -.7 | -.9 | -1.2 |
| Depreciation | ||||||||||
| Changes in Account Receivables | ||||||||||
| Changes in Inventories | ||||||||||
| Changes in Accounts Payable | ||||||||||
| Capital Expenditure | ||||||||||
| UFCF | .7 | -.6 | -2.7 | 2.4 | -.1 | .1 | 1.2 | 1.6 | 2.1 | 2.7 |
| WACC, % | 8.91 | 8.91 | 9.3 | 9.3 | 9.28 | 9.14 | 9.14 | 9.14 | 9.14 | 9.14 |
| PV UFCF | ||||||||||
| SUM PV UFCF | 5.6 | |||||||||
| Long Term Growth Rate, % | 2.00 | |||||||||
| Free cash flow (T + 1) | 3 | |||||||||
| Terminal Value | 39 | |||||||||
| Present Terminal Value | 25 | |||||||||
| Enterprise Value | 31 | |||||||||
| Net Debt | 0 | |||||||||
| Equity Value | 31 | |||||||||
| Diluted Shares Outstanding, MM | 7 | |||||||||
| Equity Value Per Share | 4.24 |
What You Will Receive
- Adjustable Input Parameters: Modify key assumptions (growth %, profit margins, discount rates) to explore various scenarios.
- Comprehensive Market Data: Data Storage Corporation’s (DTST) financial information pre-populated to facilitate your analysis.
- Instant DCF Calculations: The template automatically computes Net Present Value (NPV) and intrinsic value for your convenience.
- Tailored and Professional Design: A refined Excel model that meets your valuation requirements.
- Designed for Analysts and Investors: Perfect for evaluating forecasts, confirming strategies, and enhancing efficiency.
Key Features
- Comprehensive Data Access: DTST’s historical performance metrics and pre-filled projections.
- Customizable Parameters: Adjust WACC, tax rates, revenue growth, and EBITDA margins to fit your analysis.
- Real-Time Insights: Watch DTST’s intrinsic value update instantly as you modify inputs.
- Intuitive Visualizations: Interactive dashboard charts illustrate valuation outcomes and essential metrics.
- Designed for Precision: A reliable tool tailored for analysts, investors, and finance professionals.
How It Works
- Step 1: Download the Excel file.
- Step 2: Review pre-entered Data Storage Corporation (DTST) data (historical and projected).
- Step 3: Adjust key assumptions (yellow cells) based on your analysis.
- Step 4: View automatic recalculations for Data Storage Corporation’s (DTST) intrinsic value.
- Step 5: Use the outputs for investment decisions or reporting.
Why Choose This Calculator for Data Storage Corporation (DTST)?
- Accurate Data: Utilize real financials from Data Storage Corporation (DTST) for dependable valuation results.
- Customizable: Modify essential parameters such as growth rates, WACC, and tax rates to align with your forecasts.
- Time-Saving: Pre-configured calculations save you the effort of building from the ground up.
- Professional-Grade Tool: Tailored for investors, analysts, and consultants in the data storage industry.
- User-Friendly: Easy-to-navigate design and clear instructions ensure accessibility for all users.
Who Should Use Data Storage Corporation (DTST)?
- Investors: Gain insights into the data storage market with our advanced analytics tools.
- Data Analysts: Streamline your workflow with our user-friendly data management solutions.
- IT Consultants: Effortlessly customize our services for client-specific storage needs.
- Tech Enthusiasts: Explore innovative storage solutions and enhance your technical knowledge.
- Educators and Students: Utilize our resources as a hands-on learning experience in technology courses.
What the Template Contains
- Preloaded DTST Data: Historical and projected financial data, including revenue, EBIT, and capital expenditures.
- DCF and WACC Models: Professional-grade sheets for calculating intrinsic value and Weighted Average Cost of Capital.
- Editable Inputs: Yellow-highlighted cells for adjusting revenue growth, tax rates, and discount rates.
- Financial Statements: Comprehensive annual and quarterly financials for deeper analysis.
- Key Ratios: Profitability, leverage, and efficiency ratios to evaluate performance.
- Dashboard and Charts: Visual summaries of valuation outcomes and assumptions.
Disclaimer
All information, articles, and product details provided on this website are for general informational and educational purposes only. We do not claim any ownership over, nor do we intend to infringe upon, any trademarks, copyrights, logos, brand names, or other intellectual property mentioned or depicted on this site. Such intellectual property remains the property of its respective owners, and any references here are made solely for identification or informational purposes, without implying any affiliation, endorsement, or partnership.
We make no representations or warranties, express or implied, regarding the accuracy, completeness, or suitability of any content or products presented. Nothing on this website should be construed as legal, tax, investment, financial, medical, or other professional advice. In addition, no part of this site—including articles or product references—constitutes a solicitation, recommendation, endorsement, advertisement, or offer to buy or sell any securities, franchises, or other financial instruments, particularly in jurisdictions where such activity would be unlawful.
All content is of a general nature and may not address the specific circumstances of any individual or entity. It is not a substitute for professional advice or services. Any actions you take based on the information provided here are strictly at your own risk. You accept full responsibility for any decisions or outcomes arising from your use of this website and agree to release us from any liability in connection with your use of, or reliance upon, the content or products found herein.