
|
Duos Technologies Group, Inc. (Duot) DCF Avaliação |
Totalmente Editável: Adapte-Se Às Suas Necessidades No Excel Ou Planilhas
Design Profissional: Modelos Confiáveis E Padrão Da Indústria
Pré-Construídos Para Uso Rápido E Eficiente
Compatível com MAC/PC, totalmente desbloqueado
Não É Necessária Experiência; Fácil De Seguir
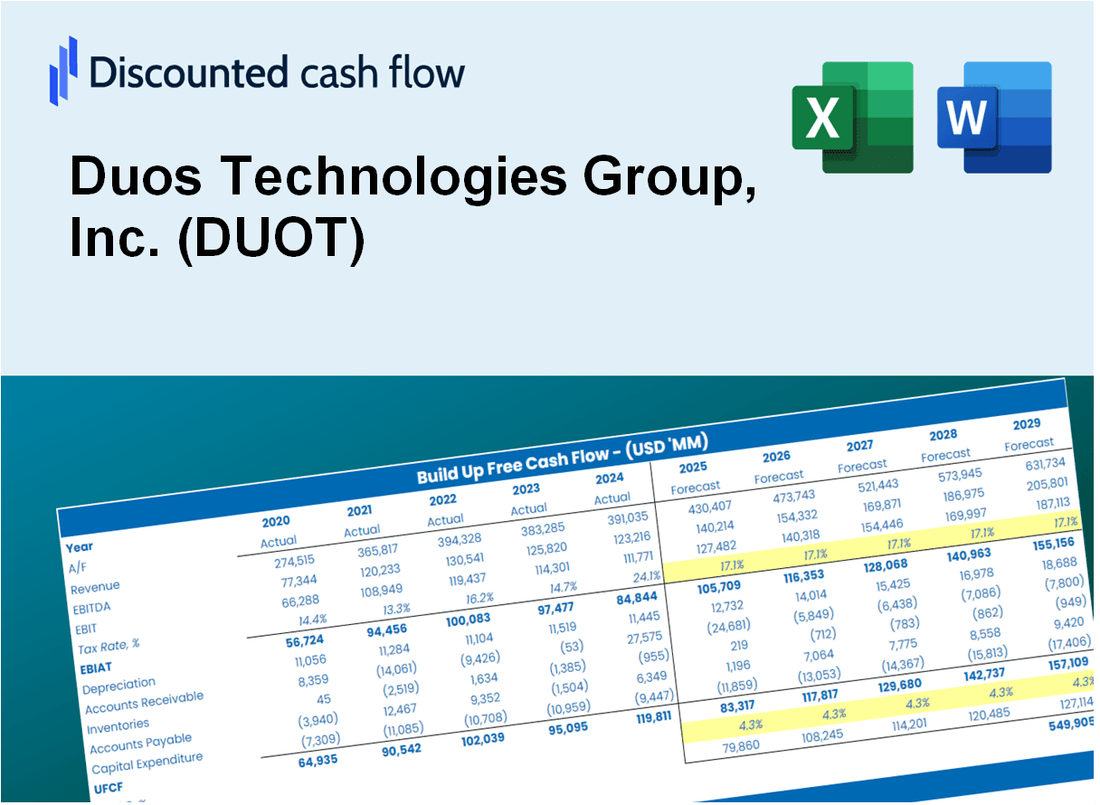
Duos Technologies Group, Inc. (DUOT) Bundle
Atualize seu processo e melhore a precisão com a nossa calculadora DCF (DUOT)! Utilizando dados reais do Duos Technologies Group, Inc. e suposições personalizáveis, essa ferramenta o capacita a prever, analisar e valorizar (Duot) como um investidor experiente.
Discounted Cash Flow (DCF) - (USD MM)
| Year | AY1 2020 |
AY2 2021 |
AY3 2022 |
AY4 2023 |
AY5 2024 |
FY1 2025 |
FY2 2026 |
FY3 2027 |
FY4 2028 |
FY5 2029 |
|---|---|---|---|---|---|---|---|---|---|---|
| Revenue | 8.0 | 8.3 | 15.0 | 7.5 | 7.3 | 7.9 | 8.5 | 9.2 | 9.9 | 10.7 |
| Revenue Growth, % | 0 | 2.74 | 81.75 | -50.23 | -2.55 | 7.93 | 7.93 | 7.93 | 7.93 | 7.93 |
| EBITDA | -6.1 | -5.4 | -6.3 | -10.4 | -7.9 | -6.0 | -6.5 | -7.0 | -7.6 | -8.2 |
| EBITDA, % | -76.38 | -65.89 | -41.76 | -138.77 | -108.79 | -76.81 | -76.81 | -76.81 | -76.81 | -76.81 |
| Depreciation | .5 | .5 | .6 | .9 | 2.6 | 1.0 | 1.1 | 1.2 | 1.2 | 1.3 |
| Depreciation, % | 5.68 | 6.61 | 3.9 | 11.6 | 35.12 | 12.58 | 12.58 | 12.58 | 12.58 | 12.58 |
| EBIT | -6.6 | -6.0 | -6.9 | -11.2 | -10.5 | -6.3 | -6.8 | -7.3 | -7.9 | -8.5 |
| EBIT, % | -82.06 | -72.5 | -45.67 | -150.37 | -143.92 | -80.05 | -80.05 | -80.05 | -80.05 | -80.05 |
| Total Cash | 4.0 | .9 | 1.1 | 2.4 | 6.3 | 2.9 | 3.2 | 3.4 | 3.7 | 4.0 |
| Total Cash, percent | .0 | .0 | .0 | .0 | .0 | .0 | .0 | .0 | .0 | .0 |
| Account Receivables | 1.3 | 1.7 | 3.8 | 2.1 | 1.0 | 1.7 | 1.8 | 1.9 | 2.1 | 2.3 |
| Account Receivables, % | 16.76 | 21.09 | 25.61 | 28.17 | 14.27 | 21.18 | 21.18 | 21.18 | 21.18 | 21.18 |
| Inventories | .1 | .3 | 1.4 | 1.5 | .6 | .7 | .7 | .8 | .9 | .9 |
| Inventories, % | 1.4 | 3.61 | 9.51 | 20.43 | 8.31 | 8.65 | 8.65 | 8.65 | 8.65 | 8.65 |
| Accounts Payable | .6 | 1.0 | 2.3 | .6 | 1.0 | .9 | 1.0 | 1.0 | 1.1 | 1.2 |
| Accounts Payable, % | 7.55 | 12.65 | 15.26 | 7.97 | 13.32 | 11.35 | 11.35 | 11.35 | 11.35 | 11.35 |
| Capital Expenditure | -.3 | -.6 | -.6 | -1.1 | -1.8 | -.9 | -.9 | -1.0 | -1.1 | -1.2 |
| Capital Expenditure, % | -3.57 | -6.69 | -4.3 | -14.64 | -25.16 | -10.87 | -10.87 | -10.87 | -10.87 | -10.87 |
| Tax Rate, % | 0 | 0 | 0 | 0 | 0 | 0 | 0 | 0 | 0 | 0 |
| EBITAT | -6.8 | -6.9 | -6.8 | -11.2 | -10.5 | -6.3 | -6.8 | -7.3 | -7.9 | -8.5 |
| Depreciation | ||||||||||
| Changes in Account Receivables | ||||||||||
| Changes in Inventories | ||||||||||
| Changes in Accounts Payable | ||||||||||
| Capital Expenditure | ||||||||||
| UFCF | -7.5 | -7.1 | -8.9 | -11.5 | -7.4 | -6.9 | -6.8 | -7.3 | -7.9 | -8.5 |
| WACC, % | 8.36 | 8.36 | 8.36 | 8.36 | 8.36 | 8.36 | 8.36 | 8.36 | 8.36 | 8.36 |
| PV UFCF | ||||||||||
| SUM PV UFCF | -29.3 | |||||||||
| Long Term Growth Rate, % | 2.00 | |||||||||
| Free cash flow (T + 1) | -9 | |||||||||
| Terminal Value | -136 | |||||||||
| Present Terminal Value | -91 | |||||||||
| Enterprise Value | -120 | |||||||||
| Net Debt | 2 | |||||||||
| Equity Value | -123 | |||||||||
| Diluted Shares Outstanding, MM | 8 | |||||||||
| Equity Value Per Share | -15.86 |
What You Will Get
- Comprehensive DUOT Financials: Access historical and projected data for precise valuation.
- Customizable Inputs: Adjust WACC, tax rates, revenue growth, and capital expenditures to fit your analysis.
- Dynamic Calculations: Intrinsic value and NPV are automatically computed in real-time.
- Scenario Analysis: Explore various scenarios to assess Duos Technologies' future performance.
- User-Friendly Design: Designed for professionals while remaining approachable for newcomers.
Key Features
- 🔍 Real-Life DUOT Financials: Pre-filled historical and projected data for Duos Technologies Group, Inc.
- ✏️ Fully Customizable Inputs: Adjust all critical parameters (yellow cells) like WACC, growth %, and tax rates.
- 📊 Professional DCF Valuation: Built-in formulas calculate Duos Technologies' intrinsic value using the Discounted Cash Flow method.
- ⚡ Instant Results: Visualize Duos Technologies' valuation instantly after making changes.
- Scenario Analysis: Test and compare outcomes for various financial assumptions side-by-side.
How It Works
- Step 1: Download the Excel file for Duos Technologies Group, Inc. (DUOT).
- Step 2: Review the pre-filled financial data and forecasts provided for Duos Technologies.
- Step 3: Modify essential inputs such as revenue growth, WACC, and tax rates (highlighted cells).
- Step 4: Observe the DCF model update in real-time as you adjust your assumptions.
- Step 5: Analyze the outputs and utilize the results to inform your investment decisions regarding Duos Technologies Group, Inc. (DUOT).
Why Choose Duos Technologies Group, Inc. (DUOT) Calculator?
- Accuracy: Utilizes real Duos Technologies financials for precise data.
- Flexibility: Tailored for users to easily adjust and test various inputs.
- Time-Saving: Avoid the complexities of constructing a financial model from the ground up.
- Professional-Grade: Crafted with the precision and usability expected by CFOs.
- User-Friendly: Intuitive interface suitable for users with any level of financial modeling expertise.
Who Should Use This Product?
- Technology Students: Explore innovative technologies and their applications in real-world scenarios.
- Researchers: Utilize advanced models to enhance studies in technology and operations.
- Investors: Evaluate your investment strategies and assess valuation metrics for Duos Technologies Group, Inc. (DUOT).
- Data Analysts: Optimize your analysis with a customizable framework tailored for tech industry evaluations.
- Entrepreneurs: Understand the methodologies used by tech firms like Duos Technologies Group, Inc. (DUOT) for strategic planning.
What the Template Contains
- Preloaded DUOT Data: Historical and projected financial data, including revenue, EBIT, and capital expenditures.
- DCF and WACC Models: Professional-grade sheets for calculating intrinsic value and Weighted Average Cost of Capital.
- Editable Inputs: Yellow-highlighted cells for adjusting revenue growth, tax rates, and discount rates.
- Financial Statements: Comprehensive annual and quarterly financials for deeper analysis.
- Key Ratios: Profitability, leverage, and efficiency ratios to evaluate performance.
- Dashboard and Charts: Visual summaries of valuation outcomes and assumptions.
Disclaimer
All information, articles, and product details provided on this website are for general informational and educational purposes only. We do not claim any ownership over, nor do we intend to infringe upon, any trademarks, copyrights, logos, brand names, or other intellectual property mentioned or depicted on this site. Such intellectual property remains the property of its respective owners, and any references here are made solely for identification or informational purposes, without implying any affiliation, endorsement, or partnership.
We make no representations or warranties, express or implied, regarding the accuracy, completeness, or suitability of any content or products presented. Nothing on this website should be construed as legal, tax, investment, financial, medical, or other professional advice. In addition, no part of this site—including articles or product references—constitutes a solicitation, recommendation, endorsement, advertisement, or offer to buy or sell any securities, franchises, or other financial instruments, particularly in jurisdictions where such activity would be unlawful.
All content is of a general nature and may not address the specific circumstances of any individual or entity. It is not a substitute for professional advice or services. Any actions you take based on the information provided here are strictly at your own risk. You accept full responsibility for any decisions or outcomes arising from your use of this website and agree to release us from any liability in connection with your use of, or reliance upon, the content or products found herein.