
|
EDP - Energia de Portugal, S.A. (EDP.LS) DCF Avaliação |
Totalmente Editável: Adapte-Se Às Suas Necessidades No Excel Ou Planilhas
Design Profissional: Modelos Confiáveis E Padrão Da Indústria
Pré-Construídos Para Uso Rápido E Eficiente
Compatível com MAC/PC, totalmente desbloqueado
Não É Necessária Experiência; Fácil De Seguir
EDP - Energias de Portugal, S.A. (EDP.LS) Bundle
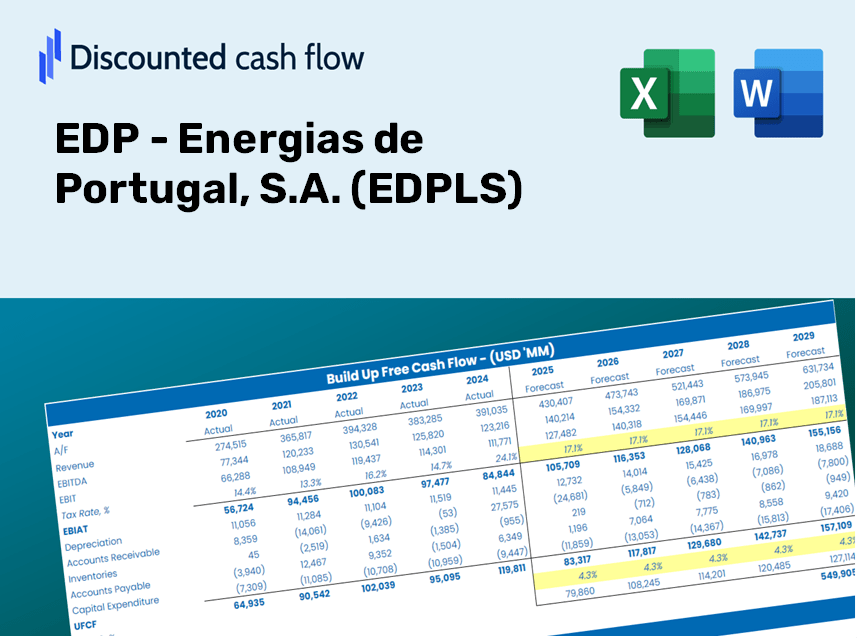
Obtenha informações sobre sua análise de avaliação EDP-Energia de Portugal, S.A. (EDPLS) com nossa calculadora DCF de última geração! Pré -carregado com dados reais do EDPLS, este modelo do Excel permite ajustar as previsões e suposições para calcular com precisão o valor intrínseco de EDP - Energia de Portugal, S.A. (EDPLS).
What You Will Receive
- Pre-Loaded Financial Model: Utilize EDP's actual data for accurate DCF valuation.
- Comprehensive Forecast Control: Modify key factors like revenue growth, profit margins, WACC, and other essential drivers.
- Real-Time Calculations: Instant updates provide immediate results as you adjust parameters.
- Professional-Grade Template: A polished Excel file crafted for high-quality valuation work.
- Flexible and Reusable: Designed for adaptability, enabling repeated use for in-depth forecasts.
Key Features
- Accurate Financial Data: Gain access to reliable historical data and future projections specifically for EDP - Energias de Portugal, S.A. (EDPLS).
- Adjustable Forecast Parameters: Customize assumptions such as WACC, growth rates, and margins in highlighted fields.
- Real-Time Calculations: Enjoy automatic updates for DCF, Net Present Value (NPV), and cash flow analysis.
- User-Friendly Dashboard: Visualize your valuation insights with easy-to-understand charts and summaries.
- Designed for All Users: An intuitive layout catering to investors, CFOs, and consultants alike, making it suitable for both novices and experts.
How It Operates
- Download the Template: Gain immediate access to the Excel-based EDP DCF Calculator for EDP - Energias de Portugal, S.A. (EDPLS).
- Input Your Assumptions: Modify the cells highlighted in yellow to set your growth rates, WACC, margins, and other parameters.
- Instant Calculations: The model will automatically refresh to show EDP's intrinsic value.
- Test Scenarios: Experiment with various assumptions to assess potential shifts in valuation.
- Analyze and Decide: Utilize the findings to inform your investment or financial evaluation.
Reasons to Choose the EDP Calculator
- Precision: Utilizes authentic EDP (EDPLS) financial data for unmatched accuracy.
- Versatility: Built to empower users to easily test and adjust inputs.
- Efficiency: Eliminate the complexities of constructing a DCF model from the ground up.
- Corporate-Quality: Crafted with the expertise and usability expected by CFOs.
- Intuitive: Designed for simplicity, making it accessible even for those new to financial modeling.
Who Should Utilize This Product?
- Investors: Effectively assess the fair value of EDP - Energias de Portugal, S.A. (EDPLS) before making investment choices.
- Chief Financial Officers (CFOs): Utilize a high-quality DCF model for comprehensive financial reporting and analysis.
- Consultants: Efficiently modify the template for client valuation reports.
- Entrepreneurs: Acquire insights into the financial modeling practices of leading utility companies.
- Educators: Employ it as a teaching resource to illustrate various valuation methodologies.
Contents of the Template
- Detailed DCF Model: An editable template featuring in-depth valuation calculations.
- Current Data: EDP - Energias de Portugal’s historical and projected financials preloaded for your analysis.
- Adjustable Parameters: Customize WACC, growth rates, and tax assumptions to explore various scenarios.
- Financial Statements: Complete annual and quarterly breakdowns for enhanced insights.
- Essential Ratios: Integrated analysis for profitability, efficiency, and leverage metrics.
- Interactive Dashboard: Visual outputs including charts and tables for clear, actionable insights.
Disclaimer
All information, articles, and product details provided on this website are for general informational and educational purposes only. We do not claim any ownership over, nor do we intend to infringe upon, any trademarks, copyrights, logos, brand names, or other intellectual property mentioned or depicted on this site. Such intellectual property remains the property of its respective owners, and any references here are made solely for identification or informational purposes, without implying any affiliation, endorsement, or partnership.
We make no representations or warranties, express or implied, regarding the accuracy, completeness, or suitability of any content or products presented. Nothing on this website should be construed as legal, tax, investment, financial, medical, or other professional advice. In addition, no part of this site—including articles or product references—constitutes a solicitation, recommendation, endorsement, advertisement, or offer to buy or sell any securities, franchises, or other financial instruments, particularly in jurisdictions where such activity would be unlawful.
All content is of a general nature and may not address the specific circumstances of any individual or entity. It is not a substitute for professional advice or services. Any actions you take based on the information provided here are strictly at your own risk. You accept full responsibility for any decisions or outcomes arising from your use of this website and agree to release us from any liability in connection with your use of, or reliance upon, the content or products found herein.