
|
Ekso Bionics Holdings, Inc. (EKSO) Avaliação DCF |
Totalmente Editável: Adapte-Se Às Suas Necessidades No Excel Ou Planilhas
Design Profissional: Modelos Confiáveis E Padrão Da Indústria
Pré-Construídos Para Uso Rápido E Eficiente
Compatível com MAC/PC, totalmente desbloqueado
Não É Necessária Experiência; Fácil De Seguir
Ekso Bionics Holdings, Inc. (EKSO) Bundle
Explore o futuro financeiro da Ekso Bionics Holdings, Inc. (EKSO) com nossa calculadora DCF amigável! Digite suas suposições de crescimento, margens e despesas para calcular o valor intrínseco da Ekso Bionics Holdings, Inc. (EKSO) e aprimore sua estratégia de investimento.
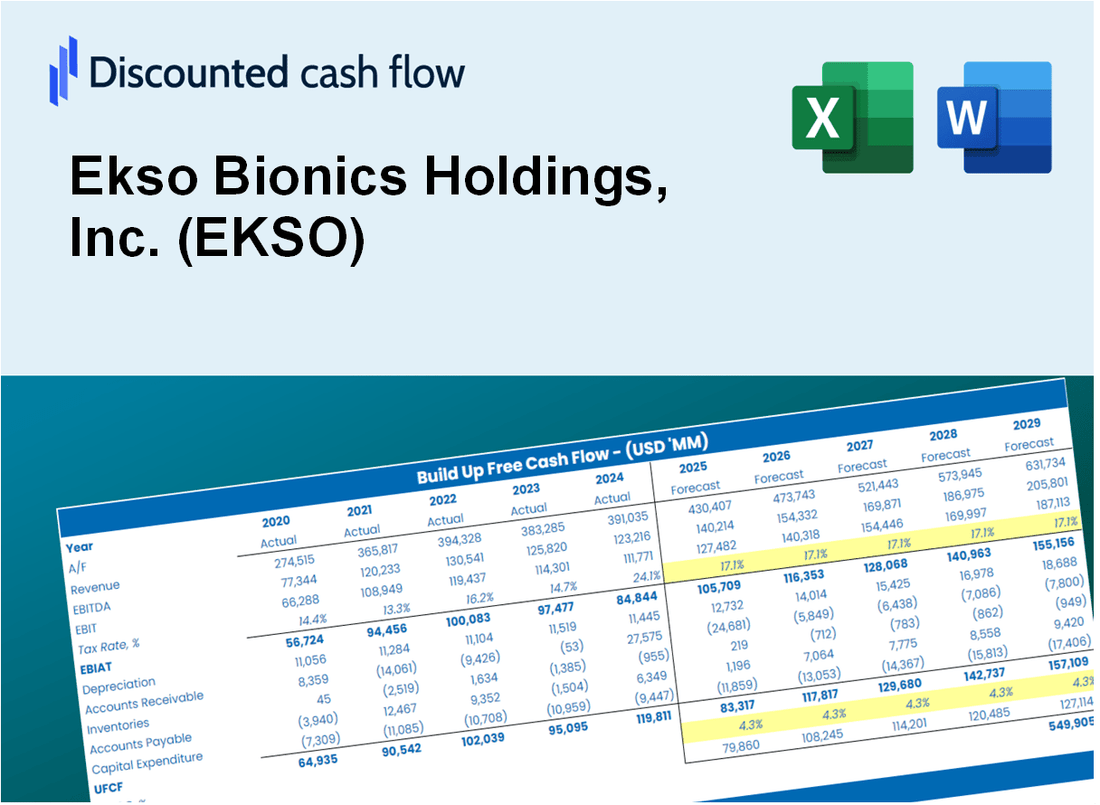
Discounted Cash Flow (DCF) - (USD MM)
| Year | AY1 2020 |
AY2 2021 |
AY3 2022 |
AY4 2023 |
AY5 2024 |
FY1 2025 |
FY2 2026 |
FY3 2027 |
FY4 2028 |
FY5 2029 |
|---|---|---|---|---|---|---|---|---|---|---|
| Revenue | 8.9 | 11.2 | 12.9 | 18.3 | 17.9 | 21.6 | 25.9 | 31.2 | 37.5 | 45.1 |
| Revenue Growth, % | 0 | 26.62 | 14.81 | 41.57 | -1.94 | 20.26 | 20.26 | 20.26 | 20.26 | 20.26 |
| EBITDA | -15.1 | -9.1 | -14.0 | -13.2 | -9.5 | -17.5 | -21.0 | -25.3 | -30.4 | -36.6 |
| EBITDA, % | -169.62 | -80.83 | -108.71 | -72.2 | -52.74 | -81.15 | -81.15 | -81.15 | -81.15 | -81.15 |
| Depreciation | .6 | .6 | .9 | 1.7 | 1.6 | 1.6 | 1.9 | 2.3 | 2.8 | 3.3 |
| Depreciation, % | 6.98 | 4.99 | 6.87 | 9.29 | 8.97 | 7.42 | 7.42 | 7.42 | 7.42 | 7.42 |
| EBIT | -15.7 | -9.7 | -14.9 | -14.9 | -11.1 | -18.5 | -22.2 | -26.8 | -32.2 | -38.7 |
| EBIT, % | -176.6 | -85.82 | -115.58 | -81.49 | -61.71 | -85.8 | -85.8 | -85.8 | -85.8 | -85.8 |
| Total Cash | 12.9 | 40.4 | 20.5 | 8.6 | 6.5 | 16.5 | 19.9 | 23.9 | 28.8 | 34.6 |
| Total Cash, percent | .0 | .0 | .0 | .0 | .0 | .0 | .0 | .0 | .0 | .0 |
| Account Receivables | 3.2 | 4.7 | 4.6 | 5.6 | 7.2 | 8.0 | 9.6 | 11.5 | 13.9 | 16.7 |
| Account Receivables, % | 36.3 | 41.45 | 35.82 | 30.88 | 40.38 | 36.97 | 36.97 | 36.97 | 36.97 | 36.97 |
| Inventories | 2.0 | 2.2 | 5.2 | 5.1 | 4.6 | 5.8 | 7.0 | 8.5 | 10.2 | 12.2 |
| Inventories, % | 22.27 | 19.94 | 40.17 | 27.63 | 25.5 | 27.1 | 27.1 | 27.1 | 27.1 | 27.1 |
| Accounts Payable | 1.5 | 3.1 | 3.2 | 1.8 | 1.6 | 3.8 | 4.5 | 5.5 | 6.6 | 7.9 |
| Accounts Payable, % | 16.9 | 27.63 | 24.4 | 10.1 | 8.66 | 17.54 | 17.54 | 17.54 | 17.54 | 17.54 |
| Capital Expenditure | .0 | -.1 | -.2 | -.2 | .0 | -.1 | -.2 | -.2 | -.2 | -.3 |
| Capital Expenditure, % | 0 | -0.52463 | -1.5 | -0.85891 | -0.20642 | -0.61849 | -0.61849 | -0.61849 | -0.61849 | -0.61849 |
| Tax Rate, % | 0 | 0 | 0 | 0 | 0 | 0 | 0 | 0 | 0 | 0 |
| EBITAT | -15.7 | -9.7 | -14.9 | -14.9 | -11.1 | -18.5 | -22.2 | -26.8 | -32.2 | -38.7 |
| Depreciation | ||||||||||
| Changes in Account Receivables | ||||||||||
| Changes in Inventories | ||||||||||
| Changes in Accounts Payable | ||||||||||
| Capital Expenditure | ||||||||||
| UFCF | -18.8 | -9.2 | -17.1 | -15.5 | -10.9 | -16.8 | -22.5 | -27.1 | -32.6 | -39.2 |
| WACC, % | 7.37 | 7.37 | 7.37 | 7.37 | 7.37 | 7.37 | 7.37 | 7.37 | 7.37 | 7.37 |
| PV UFCF | ||||||||||
| SUM PV UFCF | -109.0 | |||||||||
| Long Term Growth Rate, % | 2.00 | |||||||||
| Free cash flow (T + 1) | -40 | |||||||||
| Terminal Value | -743 | |||||||||
| Present Terminal Value | -521 | |||||||||
| Enterprise Value | -630 | |||||||||
| Net Debt | -1 | |||||||||
| Equity Value | -629 | |||||||||
| Diluted Shares Outstanding, MM | 20 | |||||||||
| Equity Value Per Share | -31.22 |
What You Will Get
- Real Ekso Data: Preloaded financials – from revenue to EBIT – based on actual and projected figures for Ekso Bionics Holdings, Inc. (EKSO).
- Full Customization: Adjust all critical parameters (yellow cells) like WACC, growth %, and tax rates to fit your analysis.
- Instant Valuation Updates: Automatic recalculations to analyze the impact of changes on Ekso Bionics' fair value.
- Versatile Excel Template: Tailored for quick edits, scenario testing, and detailed projections specific to Ekso Bionics Holdings, Inc. (EKSO).
- Time-Saving and Accurate: Skip building models from scratch while maintaining precision and flexibility in your financial assessments.
Key Features
- Innovative Exoskeleton Technology: Cutting-edge designs aimed at enhancing mobility and rehabilitation.
- Real-Time Data Analytics: Integrated analytics for monitoring performance and user engagement.
- Customizable User Interfaces: Tailor settings and preferences to individual user needs.
- Comprehensive Training Programs: Structured training modules for users and healthcare professionals.
- Robust Support and Resources: Access to a library of tutorials, manuals, and customer support.
How It Works
- Step 1: Download the prebuilt Excel template featuring Ekso Bionics Holdings, Inc. (EKSO) data.
- Step 2: Navigate through the pre-filled sheets to familiarize yourself with the essential metrics.
- Step 3: Modify forecasts and assumptions in the editable yellow cells (WACC, growth, margins).
- Step 4: Instantly see the recalibrated results, including the intrinsic value of Ekso Bionics Holdings, Inc. (EKSO).
- Step 5: Make well-informed investment decisions or create reports based on the outputs.
Why Choose This Calculator for Ekso Bionics Holdings, Inc. (EKSO)?
- Accurate Data: Utilize real Ekso Bionics financials for dependable valuation outcomes.
- Customizable: Tailor essential parameters such as growth rates, WACC, and tax rates to fit your forecasts.
- Time-Saving: Pre-configured calculations save you the hassle of starting from the ground up.
- Professional-Grade Tool: Crafted for investors, analysts, and consultants in the field.
- User-Friendly: Easy-to-navigate interface and clear instructions make it accessible for all users.
Who Should Use This Product?
- Healthcare Professionals: Understand the application of exoskeleton technology in rehabilitation settings.
- Researchers: Integrate advanced robotics concepts into studies on mobility and assistive devices.
- Investors: Evaluate your investment strategies and analyze the market potential of Ekso Bionics Holdings, Inc. (EKSO).
- Engineers: Enhance your projects with innovative designs and customizable solutions in bionic technology.
- Physical Therapists: Discover how exoskeletons can improve patient outcomes and streamline therapy sessions.
What the EKSO Template Contains
- Comprehensive DCF Model: Editable template featuring detailed valuation calculations for EKSO.
- Real-World Data: Ekso Bionics' historical and projected financials preloaded for in-depth analysis.
- Customizable Parameters: Modify WACC, growth rates, and tax assumptions to explore various scenarios.
- Financial Statements: Complete annual and quarterly breakdowns for enhanced insights into EKSO's performance.
- Key Ratios: Integrated analysis for profitability, efficiency, and leverage specific to EKSO.
- Dashboard with Visual Outputs: Engaging charts and tables for clear, actionable results.
Disclaimer
All information, articles, and product details provided on this website are for general informational and educational purposes only. We do not claim any ownership over, nor do we intend to infringe upon, any trademarks, copyrights, logos, brand names, or other intellectual property mentioned or depicted on this site. Such intellectual property remains the property of its respective owners, and any references here are made solely for identification or informational purposes, without implying any affiliation, endorsement, or partnership.
We make no representations or warranties, express or implied, regarding the accuracy, completeness, or suitability of any content or products presented. Nothing on this website should be construed as legal, tax, investment, financial, medical, or other professional advice. In addition, no part of this site—including articles or product references—constitutes a solicitation, recommendation, endorsement, advertisement, or offer to buy or sell any securities, franchises, or other financial instruments, particularly in jurisdictions where such activity would be unlawful.
All content is of a general nature and may not address the specific circumstances of any individual or entity. It is not a substitute for professional advice or services. Any actions you take based on the information provided here are strictly at your own risk. You accept full responsibility for any decisions or outcomes arising from your use of this website and agree to release us from any liability in connection with your use of, or reliance upon, the content or products found herein.