
|
Man Group Limited (EMG.L) Avaliação DCF |
Totalmente Editável: Adapte-Se Às Suas Necessidades No Excel Ou Planilhas
Design Profissional: Modelos Confiáveis E Padrão Da Indústria
Pré-Construídos Para Uso Rápido E Eficiente
Compatível com MAC/PC, totalmente desbloqueado
Não É Necessária Experiência; Fácil De Seguir
Man Group Limited (EMG.L) Bundle
Avalie as perspectivas financeiras do Man Group Limited (EMGL) como um especialista! Essa calculadora DCF (EMGL) fornece dados financeiros pré-preenchidos e permite modificar facilmente o crescimento da receita, o WACC, as margens e outras suposições críticas para se alinhar com suas projeções.
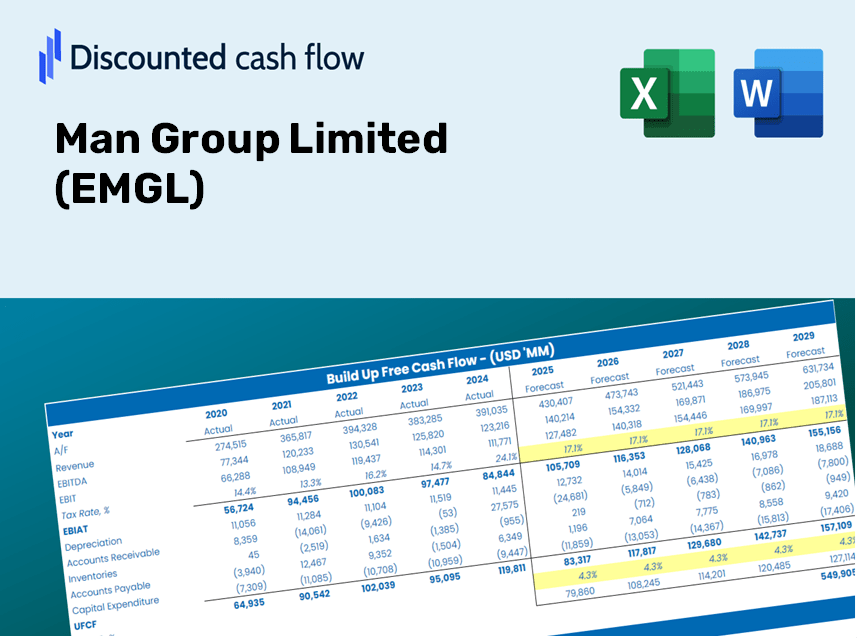
Discounted Cash Flow (DCF) - (USD MM)
| Year | AY1 2020 |
AY2 2021 |
AY3 2022 |
AY4 2023 |
AY5 2024 |
FY1 2025 |
FY2 2026 |
FY3 2027 |
FY4 2028 |
FY5 2029 |
|---|---|---|---|---|---|---|---|---|---|---|
| Revenue | 702.8 | 1,108.4 | 1,296.3 | 874.2 | 1,073.3 | 1,247.4 | 1,449.7 | 1,684.8 | 1,958.1 | 2,275.7 |
| Revenue Growth, % | 0 | 57.72 | 16.95 | -32.56 | 22.77 | 16.22 | 16.22 | 16.22 | 16.22 | 16.22 |
| EBITDA | 227.5 | 530.6 | 640.7 | 282.2 | 373.5 | 490.8 | 570.4 | 663.0 | 770.5 | 895.5 |
| EBITDA, % | 32.37 | 47.87 | 49.42 | 32.28 | 34.8 | 39.35 | 39.35 | 39.35 | 39.35 | 39.35 |
| Depreciation | 83.1 | 80.1 | 73.3 | 56.9 | 56.1 | 90.9 | 105.7 | 122.8 | 142.7 | 165.9 |
| Depreciation, % | 11.82 | 7.22 | 5.66 | 6.51 | 5.23 | 7.29 | 7.29 | 7.29 | 7.29 | 7.29 |
| EBIT | 144.5 | 450.6 | 567.3 | 225.3 | 317.3 | 399.9 | 464.8 | 540.2 | 627.8 | 729.6 |
| EBIT, % | 20.55 | 40.65 | 43.76 | 25.77 | 29.57 | 32.06 | 32.06 | 32.06 | 32.06 | 32.06 |
| Total Cash | 216.3 | 241.7 | 342.0 | 134.7 | 168.4 | 274.6 | 319.1 | 370.9 | 431.1 | 501.0 |
| Total Cash, percent | .0 | .0 | .0 | .0 | .0 | .0 | .0 | .0 | .0 | .0 |
| Account Receivables | 190.1 | 279.2 | 294.9 | 273.9 | 308.4 | 336.9 | 391.6 | 455.1 | 528.9 | 614.7 |
| Account Receivables, % | 27.05 | 25.19 | 22.75 | 31.34 | 28.73 | 27.01 | 27.01 | 27.01 | 27.01 | 27.01 |
| Inventories | -42.7 | -41.2 | -294.9 | .0 | .0 | -81.2 | -94.3 | -109.6 | -127.4 | -148.1 |
| Inventories, % | -6.07 | -3.71 | -22.75 | 0 | 0 | -6.51 | -6.51 | -6.51 | -6.51 | -6.51 |
| Accounts Payable | 5.2 | 504.5 | 651.9 | 5.2 | 3.7 | 243.2 | 282.7 | 328.5 | 381.8 | 443.7 |
| Accounts Payable, % | 0.74547 | 45.51 | 50.29 | 0.59932 | 0.34868 | 19.5 | 19.5 | 19.5 | 19.5 | 19.5 |
| Capital Expenditure | -22.5 | -36.7 | -33.7 | -24.7 | -30.7 | -36.9 | -42.9 | -49.8 | -57.9 | -67.3 |
| Capital Expenditure, % | -3.19 | -3.31 | -2.6 | -2.83 | -2.86 | -2.96 | -2.96 | -2.96 | -2.96 | -2.96 |
| Tax Rate, % | 25.13 | 25.13 | 25.13 | 25.13 | 25.13 | 25.13 | 25.13 | 25.13 | 25.13 | 25.13 |
| EBITAT | 111.4 | 371.9 | 463.0 | 188.9 | 237.6 | 319.9 | 371.8 | 432.1 | 502.2 | 583.7 |
| Depreciation | ||||||||||
| Changes in Account Receivables | ||||||||||
| Changes in Inventories | ||||||||||
| Changes in Accounts Payable | ||||||||||
| Capital Expenditure | ||||||||||
| UFCF | 29.8 | 824.0 | 888.1 | -699.5 | 227.1 | 666.0 | 432.6 | 502.7 | 584.3 | 679.0 |
| WACC, % | 6.88 | 6.92 | 6.92 | 6.93 | 6.86 | 6.9 | 6.9 | 6.9 | 6.9 | 6.9 |
| PV UFCF | ||||||||||
| SUM PV UFCF | 2,346.7 | |||||||||
| Long Term Growth Rate, % | 2.00 | |||||||||
| Free cash flow (T + 1) | 693 | |||||||||
| Terminal Value | 14,124 | |||||||||
| Present Terminal Value | 10,116 | |||||||||
| Enterprise Value | 12,462 | |||||||||
| Net Debt | 17 | |||||||||
| Equity Value | 12,445 | |||||||||
| Diluted Shares Outstanding, MM | 1,189 | |||||||||
| Equity Value Per Share | 1,046.62 |
What You Will Receive
- Adjustable Forecast Inputs: Easily modify assumptions (growth %, margins, WACC) to explore various scenarios.
- Real-World Data: Man Group Limited's (EMGL) financial data pre-loaded to accelerate your analysis.
- Automated DCF Outputs: The template computes Net Present Value (NPV) and intrinsic value for your convenience.
- Customizable and Professional: A sophisticated Excel model tailored to meet your valuation requirements.
- Designed for Analysts and Investors: Perfect for testing projections, validating strategies, and enhancing efficiency.
Key Features
- Comprehensive DCF Model: Features extensive unlevered and levered DCF valuation frameworks tailored for Man Group Limited (EMGL).
- WACC Calculator: Comes with a pre-configured Weighted Average Cost of Capital sheet that allows for easy input customization.
- Modifiable Forecast Inputs: Adjust growth projections, capital spending, and discount rates to fit your analysis needs.
- Integrated Financial Ratios: Evaluate profitability, leverage, and efficiency ratios specifically for Man Group Limited (EMGL).
- Interactive Dashboard and Charts: Visual representations present essential valuation metrics for straightforward interpretation and analysis.
How It Works
- Step 1: Download the prebuilt Excel template with Man Group Limited's (EMGL) data included.
- Step 2: Explore the pre-filled sheets to familiarize yourself with the key metrics.
- Step 3: Update forecasts and assumptions in the editable yellow cells (WACC, growth, margins).
- Step 4: Instantly view the recalculated results, including the intrinsic value of Man Group Limited (EMGL).
- Step 5: Make informed investment decisions or generate reports based on the outputs.
Why Choose the Man Group Limited (EMGL) Calculator?
- Save Time: Skip the hassle of building a DCF model from ground up – it’s ready for immediate use.
- Enhance Accuracy: Dependable financial data and formulas minimize valuation errors.
- Completely Customizable: Adjust the model to suit your specific assumptions and forecasts.
- Simple to Analyze: Intuitive charts and outputs make interpreting the results straightforward.
- Preferred by Professionals: Crafted for experts who prioritize precision and ease of use.
Who Should Use This Product?
- Finance Students: Master valuation methodologies and apply them with real market data relevant to Man Group Limited (EMGL).
- Academics: Utilize professional financial models for your courses or research focused on Man Group Limited (EMGL).
- Investors: Explore your hypotheses and evaluate valuation results for Man Group Limited (EMGL) stock.
- Analysts: Enhance your efficiency with a customizable, pre-designed DCF model tailored for Man Group Limited (EMGL).
- Small Business Owners: Discover how large public entities like Man Group Limited (EMGL) are assessed and valued.
Contents of the Template
- Pre-Filled Data: Features historical financials and forecasts for Man Group Limited (EMGL).
- Discounted Cash Flow Model: An editable DCF valuation template with automatic calculations.
- Weighted Average Cost of Capital (WACC): A dedicated worksheet for determining WACC using customized inputs.
- Key Financial Ratios: Evaluate Man Group Limited's profitability, efficiency, and financial leverage.
- Customizable Inputs: Easily modify revenue growth, margins, and tax rates.
- Intuitive Dashboard: Visuals and tables that summarize the primary valuation outcomes.
Disclaimer
All information, articles, and product details provided on this website are for general informational and educational purposes only. We do not claim any ownership over, nor do we intend to infringe upon, any trademarks, copyrights, logos, brand names, or other intellectual property mentioned or depicted on this site. Such intellectual property remains the property of its respective owners, and any references here are made solely for identification or informational purposes, without implying any affiliation, endorsement, or partnership.
We make no representations or warranties, express or implied, regarding the accuracy, completeness, or suitability of any content or products presented. Nothing on this website should be construed as legal, tax, investment, financial, medical, or other professional advice. In addition, no part of this site—including articles or product references—constitutes a solicitation, recommendation, endorsement, advertisement, or offer to buy or sell any securities, franchises, or other financial instruments, particularly in jurisdictions where such activity would be unlawful.
All content is of a general nature and may not address the specific circumstances of any individual or entity. It is not a substitute for professional advice or services. Any actions you take based on the information provided here are strictly at your own risk. You accept full responsibility for any decisions or outcomes arising from your use of this website and agree to release us from any liability in connection with your use of, or reliance upon, the content or products found herein.