
|
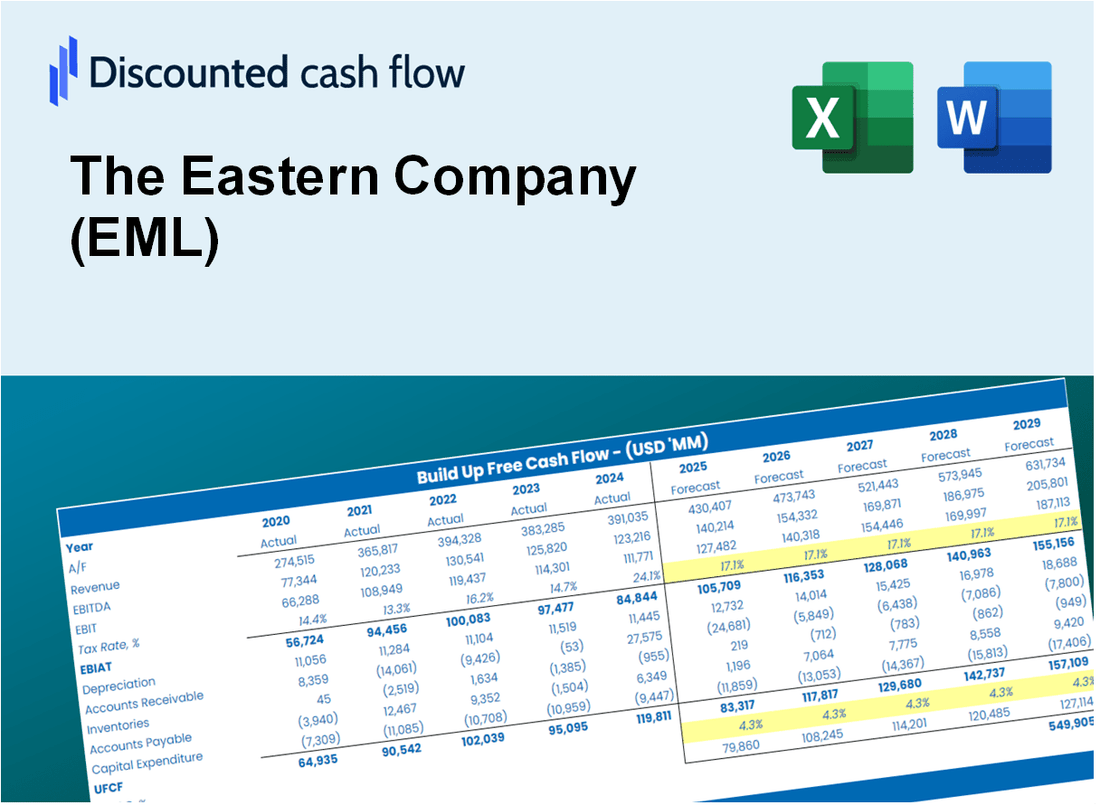
A Avaliação DCF da Companhia Oriental (EML) |
Totalmente Editável: Adapte-Se Às Suas Necessidades No Excel Ou Planilhas
Design Profissional: Modelos Confiáveis E Padrão Da Indústria
Pré-Construídos Para Uso Rápido E Eficiente
Compatível com MAC/PC, totalmente desbloqueado
Não É Necessária Experiência; Fácil De Seguir
The Eastern Company (EML) Bundle
Explore as perspectivas financeiras da Eastern Company (EML) com nossa calculadora DCF! Basta inserir suas projeções de crescimento, margens de lucro e despesas para calcular o valor intrínseco da Companhia Oriental (EML) e aprimorar sua abordagem de investimento.
Discounted Cash Flow (DCF) - (USD MM)
| Year | AY1 2020 |
AY2 2021 |
AY3 2022 |
AY4 2023 |
AY5 2024 |
FY1 2025 |
FY2 2026 |
FY3 2027 |
FY4 2028 |
FY5 2029 |
|---|---|---|---|---|---|---|---|---|---|---|
| Revenue | 197.6 | 246.5 | 279.3 | 258.9 | 272.8 | 297.4 | 324.2 | 353.4 | 385.3 | 420.1 |
| Revenue Growth, % | 0 | 24.75 | 13.28 | -7.31 | 5.37 | 9.02 | 9.02 | 9.02 | 9.02 | 9.02 |
| EBITDA | 22.1 | 28.1 | 23.9 | 23.3 | 25.7 | 29.5 | 32.1 | 35.0 | 38.2 | 41.6 |
| EBITDA, % | 11.18 | 11.38 | 8.56 | 8.98 | 9.42 | 9.9 | 9.9 | 9.9 | 9.9 | 9.9 |
| Depreciation | 6.8 | 7.2 | 7.2 | 5.4 | 5.9 | 7.9 | 8.6 | 9.3 | 10.2 | 11.1 |
| Depreciation, % | 3.45 | 2.94 | 2.59 | 2.07 | 2.16 | 2.64 | 2.64 | 2.64 | 2.64 | 2.64 |
| EBIT | 15.3 | 20.8 | 16.7 | 17.9 | 19.8 | 21.6 | 23.5 | 25.7 | 28.0 | 30.5 |
| EBIT, % | 7.73 | 8.44 | 5.97 | 6.91 | 7.26 | 7.26 | 7.26 | 7.26 | 7.26 | 7.26 |
| Total Cash | 15.3 | 6.2 | 10.2 | 9.3 | 16.1 | 13.9 | 15.2 | 16.5 | 18.0 | 19.6 |
| Total Cash, percent | .0 | .0 | .0 | .0 | .0 | .0 | .0 | .0 | .0 | .0 |
| Account Receivables | 31.8 | 44.2 | 43.9 | 37.6 | 35.8 | 46.0 | 50.2 | 54.7 | 59.6 | 65.0 |
| Account Receivables, % | 16.09 | 17.92 | 15.72 | 14.54 | 13.13 | 15.48 | 15.48 | 15.48 | 15.48 | 15.48 |
| Inventories | 43.1 | 62.9 | 64.6 | 59.3 | 55.2 | 67.6 | 73.7 | 80.3 | 87.6 | 95.5 |
| Inventories, % | 21.82 | 25.5 | 23.15 | 22.9 | 20.24 | 22.72 | 22.72 | 22.72 | 22.72 | 22.72 |
| Accounts Payable | 21.3 | 29.6 | 27.6 | 25.3 | 19.7 | 29.6 | 32.2 | 35.1 | 38.3 | 41.7 |
| Accounts Payable, % | 10.78 | 12.02 | 9.9 | 9.78 | 7.2 | 9.94 | 9.94 | 9.94 | 9.94 | 9.94 |
| Capital Expenditure | -3.1 | -3.7 | -3.4 | -6.4 | -9.7 | -6.1 | -6.7 | -7.3 | -8.0 | -8.7 |
| Capital Expenditure, % | -1.57 | -1.51 | -1.21 | -2.49 | -3.56 | -2.07 | -2.07 | -2.07 | -2.07 | -2.07 |
| Tax Rate, % | 149.95 | 149.95 | 149.95 | 149.95 | 149.95 | 149.95 | 149.95 | 149.95 | 149.95 | 149.95 |
| EBITAT | 6.2 | 10.2 | 14.2 | 10.2 | -9.9 | 10.0 | 10.9 | 11.9 | 13.0 | 14.2 |
| Depreciation | ||||||||||
| Changes in Account Receivables | ||||||||||
| Changes in Inventories | ||||||||||
| Changes in Accounts Payable | ||||||||||
| Capital Expenditure | ||||||||||
| UFCF | -43.7 | -10.1 | 14.6 | 18.4 | -13.5 | -.9 | 5.2 | 5.7 | 6.2 | 6.8 |
| WACC, % | 6.36 | 6.49 | 7.04 | 6.61 | 5.74 | 6.45 | 6.45 | 6.45 | 6.45 | 6.45 |
| PV UFCF | ||||||||||
| SUM PV UFCF | 18.2 | |||||||||
| Long Term Growth Rate, % | 0.50 | |||||||||
| Free cash flow (T + 1) | 7 | |||||||||
| Terminal Value | 114 | |||||||||
| Present Terminal Value | 84 | |||||||||
| Enterprise Value | 102 | |||||||||
| Net Debt | 43 | |||||||||
| Equity Value | 59 | |||||||||
| Diluted Shares Outstanding, MM | 6 | |||||||||
| Equity Value Per Share | 9.52 |
What You Will Receive
- Customizable Excel Template: A fully editable Excel-based DCF Calculator featuring pre-filled financial data for The Eastern Company (EML).
- Accurate Historical Data: Access to past performance data and future estimates (highlighted in the yellow cells).
- Adjustable Forecasts: Modify key assumptions such as revenue growth, EBITDA %, and WACC to fit your analysis.
- Instant Calculations: View the immediate effects of your inputs on The Eastern Company’s (EML) valuation.
- Professional Resource: Designed for investors, CFOs, consultants, and financial analysts alike.
- Intuitive Layout: Organized for easy navigation and understanding, complete with step-by-step guidance.
Key Features
- Comprehensive Financial Data: Gain access to accurate historical performance and future forecasts for The Eastern Company (EML).
- Adjustable Forecast Parameters: Modify highlighted fields such as WACC, growth rates, and profit margins to tailor your analysis.
- Automated Financial Calculations: Enjoy real-time updates to DCF, Net Present Value (NPV), and cash flow metrics.
- User-Friendly Dashboard: Intuitive charts and summaries to help you easily interpret your valuation findings.
- Designed for All Skill Levels: A straightforward, accessible layout suitable for investors, CFOs, and financial consultants.
How It Works
- Step 1: Download the prebuilt Excel template featuring The Eastern Company's (EML) data.
- Step 2: Navigate through the pre-filled sheets to grasp the essential metrics.
- Step 3: Modify forecasts and assumptions in the editable yellow cells (WACC, growth, margins).
- Step 4: Instantly see the recalculated results, including The Eastern Company's (EML) intrinsic value.
- Step 5: Make informed investment choices or create reports based on the outputs.
Why Choose This Calculator for The Eastern Company (EML)?
- User-Friendly Interface: Tailored for both novices and seasoned professionals.
- Customizable Parameters: Adjust inputs effortlessly to suit your financial analysis.
- Real-Time Feedback: Observe immediate changes in The Eastern Company’s valuation as you modify inputs.
- Preloaded Financials: Comes equipped with The Eastern Company’s actual financial data for swift evaluations.
- Relied Upon by Experts: Favored by investors and analysts for making well-informed choices.
Who Should Use This Product?
- Investors: Accurately assess The Eastern Company’s (EML) fair value before making investment choices.
- CFOs: Utilize a professional-grade DCF model for comprehensive financial reporting and analysis.
- Consultants: Easily modify the template for valuation reports tailored to clients’ needs.
- Entrepreneurs: Acquire insights into financial modeling practices employed by leading corporations.
- Educators: Implement it as a teaching resource to illustrate various valuation methodologies.
What the Template Contains
- Historical Data: Includes The Eastern Company’s past financials and baseline forecasts.
- DCF and Levered DCF Models: Detailed templates to calculate The Eastern Company’s intrinsic value.
- WACC Sheet: Pre-built calculations for Weighted Average Cost of Capital.
- Editable Inputs: Modify key drivers like growth rates, EBITDA %, and CAPEX assumptions.
- Quarterly and Annual Statements: A complete breakdown of The Eastern Company’s financials.
- Interactive Dashboard: Visualize valuation results and projections dynamically.
Disclaimer
All information, articles, and product details provided on this website are for general informational and educational purposes only. We do not claim any ownership over, nor do we intend to infringe upon, any trademarks, copyrights, logos, brand names, or other intellectual property mentioned or depicted on this site. Such intellectual property remains the property of its respective owners, and any references here are made solely for identification or informational purposes, without implying any affiliation, endorsement, or partnership.
We make no representations or warranties, express or implied, regarding the accuracy, completeness, or suitability of any content or products presented. Nothing on this website should be construed as legal, tax, investment, financial, medical, or other professional advice. In addition, no part of this site—including articles or product references—constitutes a solicitation, recommendation, endorsement, advertisement, or offer to buy or sell any securities, franchises, or other financial instruments, particularly in jurisdictions where such activity would be unlawful.
All content is of a general nature and may not address the specific circumstances of any individual or entity. It is not a substitute for professional advice or services. Any actions you take based on the information provided here are strictly at your own risk. You accept full responsibility for any decisions or outcomes arising from your use of this website and agree to release us from any liability in connection with your use of, or reliance upon, the content or products found herein.