
|
Engenheiros India Limited (Enginersin.NS) Avaliação DCF |
Totalmente Editável: Adapte-Se Às Suas Necessidades No Excel Ou Planilhas
Design Profissional: Modelos Confiáveis E Padrão Da Indústria
Pré-Construídos Para Uso Rápido E Eficiente
Compatível com MAC/PC, totalmente desbloqueado
Não É Necessária Experiência; Fácil De Seguir
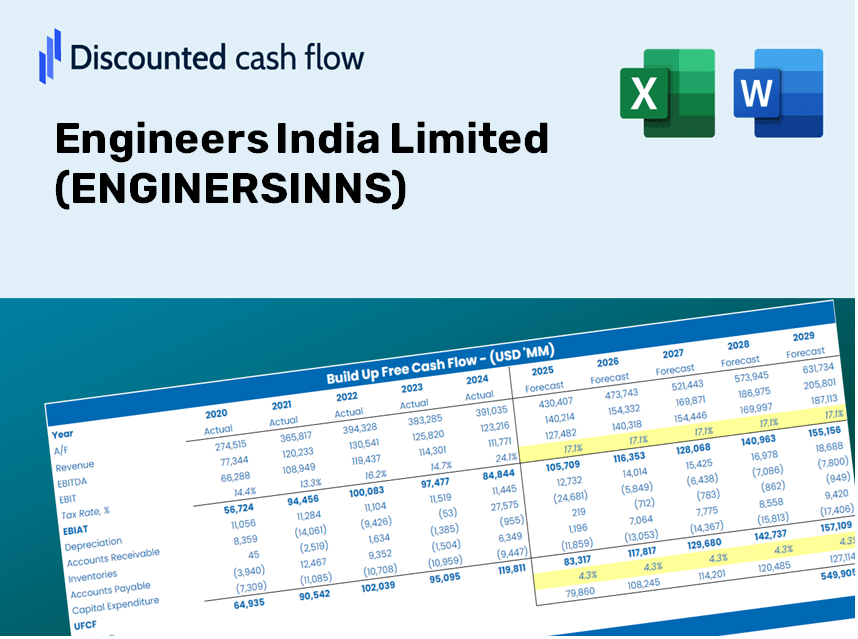
Engineers India Limited (ENGINERSIN.NS) Bundle
Avalie as perspectivas financeiras da Engineers India Limited como um especialista! Essa calculadora DCF (Enginersinns) vem com dados financeiros pré-preenchidos e oferece flexibilidade total para modificar o crescimento da receita, o WACC, as margens e outras suposições críticas para se alinhar às suas projeções.
What You Will Receive
- Comprehensive ENGINERSINNS Financial Data: Pre-loaded with historical and forecasted data for in-depth analysis.
- Customizable Template: Easily adjust key variables such as revenue growth, WACC, and EBITDA %.
- Instantaneous Calculations: Observe real-time updates to ENGINERSINNS's intrinsic value as you make changes.
- Expert Valuation Tool: Tailored for investors, analysts, and consultants looking for reliable DCF outcomes.
- Intuitive Layout: User-friendly structure and straightforward instructions suitable for all skill levels.
Key Features
- 🔍 Real-Life ENGINERSINNS Financials: Pre-filled historical and projected data for Engineers India Limited.
- ✏️ Fully Customizable Inputs: Modify all essential parameters (yellow cells) such as WACC, growth %, and tax rates.
- 📊 Professional DCF Valuation: Integrated formulas assess Engineers India’s intrinsic value using the Discounted Cash Flow method.
- ⚡ Instant Results: Visualize the valuation of Engineers India immediately after adjustments.
- Scenario Analysis: Analyze and compare different outcomes based on various financial assumptions side-by-side.
How It Works
- Step 1: Download the prebuilt Excel template containing Engineers India Limited’s (ENGINERSINNS) data.
- Step 2: Navigate through the pre-filled sheets to familiarize yourself with the key metrics.
- Step 3: Modify forecasts and assumptions in the editable yellow cells (WACC, growth, margins).
- Step 4: Instantly access recalculated results, including Engineers India Limited’s (ENGINERSINNS) intrinsic value.
- Step 5: Use the outputs to make informed investment decisions or generate comprehensive reports.
Why Choose This Calculator for Engineers India Limited (ENGINERSINNS)?
- Precise Financials: Access accurate Engineers India Limited financial data for dependable valuation outcomes.
- Personalizable: Modify essential variables such as growth rates, WACC, and tax rates to align with your forecasts.
- Efficient: Built-in calculations save you the hassle of starting from the beginning.
- Expert-Level Tool: Tailored for investors, analysts, and consultants in the engineering sector.
- Intuitive Design: User-friendly interface and clear step-by-step guidelines cater to users of all experience levels.
Who Can Benefit from This Product?
- Individual Investors: Make informed choices about buying or selling Engineers India Limited (ENGINERSINNS) stock.
- Financial Analysts: Enhance valuation processes with easy-to-use financial models tailored for Engineers India Limited (ENGINERSINNS).
- Consultants: Provide clients with accurate and timely valuation insights for Engineers India Limited (ENGINERSINNS).
- Business Owners: Gain insights into how major companies like Engineers India Limited (ENGINERSINNS) are valued to inform your own business strategies.
- Finance Students: Master valuation techniques with practical examples and data related to Engineers India Limited (ENGINERSINNS).
Contents of the Template
- Historical Data: Presents Engineers India Limited's (ENGINERSINNS) previous financial performance and foundational forecasts.
- DCF and Levered DCF Models: Comprehensive templates for assessing the intrinsic value of Engineers India Limited (ENGINERSINNS).
- WACC Sheet: Pre-populated calculations for the Weighted Average Cost of Capital.
- Editable Inputs: Customize essential drivers, including growth rates, EBITDA percentages, and CAPEX estimates.
- Quarterly and Annual Statements: A thorough overview of Engineers India Limited's (ENGINERSINNS) financials.
- Interactive Dashboard: A dynamic interface to visualize valuation results and forecasts.
Disclaimer
All information, articles, and product details provided on this website are for general informational and educational purposes only. We do not claim any ownership over, nor do we intend to infringe upon, any trademarks, copyrights, logos, brand names, or other intellectual property mentioned or depicted on this site. Such intellectual property remains the property of its respective owners, and any references here are made solely for identification or informational purposes, without implying any affiliation, endorsement, or partnership.
We make no representations or warranties, express or implied, regarding the accuracy, completeness, or suitability of any content or products presented. Nothing on this website should be construed as legal, tax, investment, financial, medical, or other professional advice. In addition, no part of this site—including articles or product references—constitutes a solicitation, recommendation, endorsement, advertisement, or offer to buy or sell any securities, franchises, or other financial instruments, particularly in jurisdictions where such activity would be unlawful.
All content is of a general nature and may not address the specific circumstances of any individual or entity. It is not a substitute for professional advice or services. Any actions you take based on the information provided here are strictly at your own risk. You accept full responsibility for any decisions or outcomes arising from your use of this website and agree to release us from any liability in connection with your use of, or reliance upon, the content or products found herein.