
|
Avaliação da Eagle Materials Inc. (EXP) |
Totalmente Editável: Adapte-Se Às Suas Necessidades No Excel Ou Planilhas
Design Profissional: Modelos Confiáveis E Padrão Da Indústria
Pré-Construídos Para Uso Rápido E Eficiente
Compatível com MAC/PC, totalmente desbloqueado
Não É Necessária Experiência; Fácil De Seguir
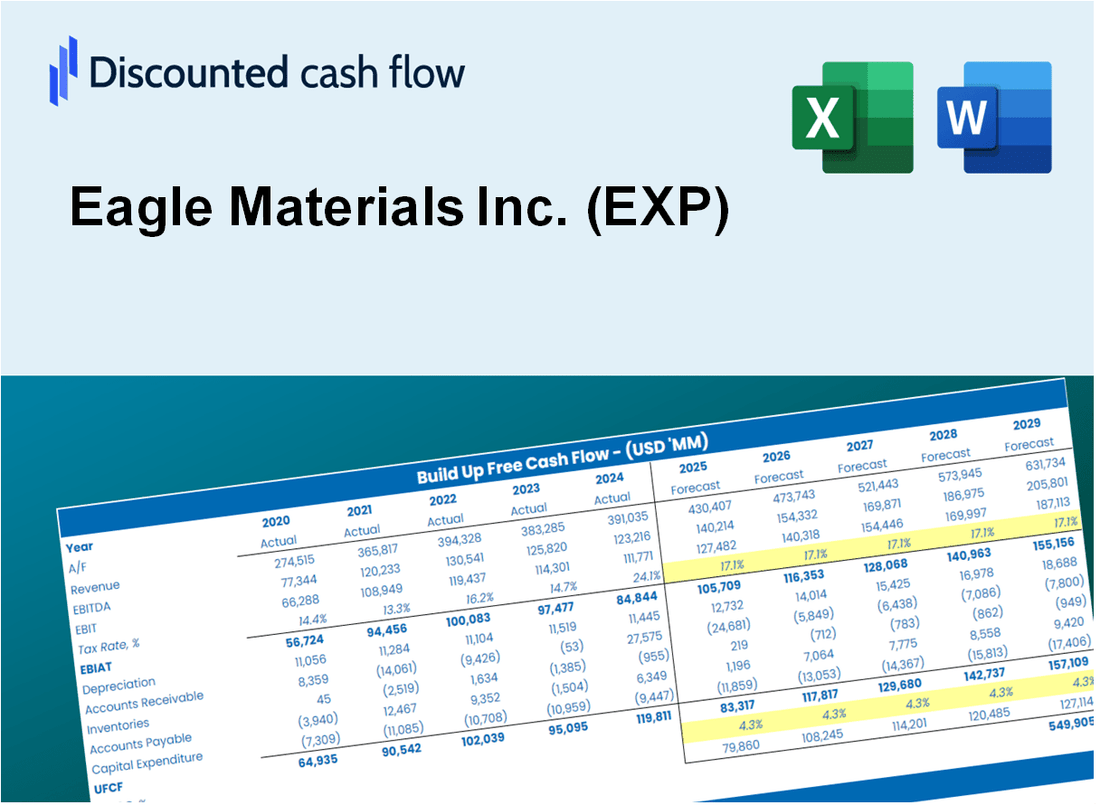
Eagle Materials Inc. (EXP) Bundle
Avalie as perspectivas financeiras da Eagle Materials Inc. (EXP) como um especialista! Esta calculadora (exp) DCF fornece dados financeiros pré-preenchidos e a flexibilidade completa para modificar o crescimento da receita, o WACC, as margens e outras suposições essenciais para se alinhar com suas previsões.
Discounted Cash Flow (DCF) - (USD MM)
| Year | AY1 2020 |
AY2 2021 |
AY3 2022 |
AY4 2023 |
AY5 2024 |
FY1 2025 |
FY2 2026 |
FY3 2027 |
FY4 2028 |
FY5 2029 |
|---|---|---|---|---|---|---|---|---|---|---|
| Revenue | 1,622.6 | 1,861.5 | 2,148.1 | 2,259.3 | 2,260.5 | 2,460.3 | 2,677.7 | 2,914.3 | 3,171.8 | 3,452.1 |
| Revenue Growth, % | 0 | 14.72 | 15.39 | 5.18 | 0.05360074 | 8.84 | 8.84 | 8.84 | 8.84 | 8.84 |
| EBITDA | 597.7 | 634.8 | 762.7 | 811.1 | 792.6 | 872.9 | 950.1 | 1,034.0 | 1,125.4 | 1,224.9 |
| EBITDA, % | 36.83 | 34.1 | 35.51 | 35.9 | 35.06 | 35.48 | 35.48 | 35.48 | 35.48 | 35.48 |
| Depreciation | 129.1 | 128.8 | 138.6 | 149.8 | 158.9 | 172.2 | 187.4 | 203.9 | 221.9 | 241.6 |
| Depreciation, % | 7.96 | 6.92 | 6.45 | 6.63 | 7.03 | 7 | 7 | 7 | 7 | 7 |
| EBIT | 468.6 | 506.0 | 624.2 | 661.2 | 633.7 | 700.8 | 762.7 | 830.1 | 903.5 | 983.3 |
| EBIT, % | 28.88 | 27.18 | 29.06 | 29.27 | 28.03 | 28.48 | 28.48 | 28.48 | 28.48 | 28.48 |
| Total Cash | 263.5 | 19.4 | 15.2 | 34.9 | 20.4 | 100.6 | 109.5 | 119.1 | 129.7 | 141.1 |
| Total Cash, percent | .0 | .0 | .0 | .0 | .0 | .0 | .0 | .0 | .0 | .0 |
| Account Receivables | 150.0 | 183.5 | 211.3 | 212.9 | 222.4 | 237.1 | 258.1 | 280.9 | 305.7 | 332.8 |
| Account Receivables, % | 9.24 | 9.86 | 9.84 | 9.42 | 9.84 | 9.64 | 9.64 | 9.64 | 9.64 | 9.64 |
| Inventories | 235.7 | 236.7 | 291.9 | 373.9 | 415.2 | 372.7 | 405.7 | 441.5 | 480.5 | 523.0 |
| Inventories, % | 14.53 | 12.71 | 13.59 | 16.55 | 18.37 | 15.15 | 15.15 | 15.15 | 15.15 | 15.15 |
| Accounts Payable | 84.2 | 113.7 | 110.4 | 127.2 | 129.9 | 136.8 | 148.9 | 162.1 | 176.4 | 192.0 |
| Accounts Payable, % | 5.19 | 6.11 | 5.14 | 5.63 | 5.75 | 5.56 | 5.56 | 5.56 | 5.56 | 5.56 |
| Capital Expenditure | -53.9 | -74.1 | -110.1 | -120.3 | -195.3 | -129.9 | -141.4 | -153.9 | -167.5 | -182.2 |
| Capital Expenditure, % | -3.32 | -3.98 | -5.13 | -5.32 | -8.64 | -5.28 | -5.28 | -5.28 | -5.28 | -5.28 |
| Tax Rate, % | 21.65 | 21.65 | 21.65 | 21.65 | 21.65 | 21.65 | 21.65 | 21.65 | 21.65 | 21.65 |
| EBITAT | 375.0 | 398.6 | 489.4 | 511.1 | 496.5 | 550.6 | 599.3 | 652.2 | 709.9 | 772.6 |
| Depreciation | ||||||||||
| Changes in Account Receivables | ||||||||||
| Changes in Inventories | ||||||||||
| Changes in Accounts Payable | ||||||||||
| Capital Expenditure | ||||||||||
| UFCF | 148.7 | 448.4 | 431.5 | 473.8 | 412.1 | 627.5 | 603.5 | 656.8 | 714.9 | 778.0 |
| WACC, % | 9.09 | 9.09 | 9.08 | 9.08 | 9.08 | 9.09 | 9.09 | 9.09 | 9.09 | 9.09 |
| PV UFCF | ||||||||||
| SUM PV UFCF | 2,596.9 | |||||||||
| Long Term Growth Rate, % | 3.00 | |||||||||
| Free cash flow (T + 1) | 801 | |||||||||
| Terminal Value | 13,168 | |||||||||
| Present Terminal Value | 8,525 | |||||||||
| Enterprise Value | 11,122 | |||||||||
| Net Debt | 1,256 | |||||||||
| Equity Value | 9,866 | |||||||||
| Diluted Shares Outstanding, MM | 34 | |||||||||
| Equity Value Per Share | 293.23 |
What You Will Get
- Comprehensive EXP Financials: Access to historical and projected data for precise valuation.
- Customizable Inputs: Adjust WACC, tax rates, revenue growth, and capital expenditures to suit your analysis.
- Dynamic Calculations: Intrinsic value and NPV are computed automatically.
- Scenario Analysis: Evaluate various scenarios to assess Eagle Materials' future performance.
- User-Friendly Design: Crafted for professionals while remaining approachable for newcomers.
Key Features
- Comprehensive Financial Data: Eagle Materials Inc.'s historical financial statements and pre-filled projections.
- Customizable Parameters: Adjust WACC, tax rates, revenue growth, and EBITDA margins as needed.
- Real-Time Calculations: Instantly view Eagle Materials Inc.'s intrinsic value updates.
- Intuitive Visualizations: Dashboard graphs illustrate valuation results and essential metrics.
- Precision Engineered: A reliable tool designed for analysts, investors, and finance professionals.
How It Works
- Step 1: Download the prebuilt Excel template featuring Eagle Materials Inc. (EXP) data.
- Step 2: Navigate through the pre-filled sheets to familiarize yourself with the essential metrics.
- Step 3: Adjust forecasts and assumptions in the editable yellow cells (WACC, growth, margins).
- Step 4: Instantly see the recalculated results, including Eagle Materials Inc.'s (EXP) intrinsic value.
- Step 5: Make well-informed investment decisions or create reports based on the outputs.
Why Choose This Calculator for Eagle Materials Inc. (EXP)?
- Accurate Data: Access to real Eagle Materials financials ensures trustworthy valuation outcomes.
- Customizable: Tailor essential parameters such as growth rates, WACC, and tax rates to align with your forecasts.
- Time-Saving: Pre-configured calculations save you from starting from the ground up.
- Professional-Grade Tool: Crafted for investors, analysts, and consultants in the construction materials sector.
- User-Friendly: An intuitive interface and clear step-by-step guidance make it accessible for all users.
Who Should Use This Product?
- Finance Students: Explore valuation methodologies and practice with real-world data specific to Eagle Materials Inc. (EXP).
- Academics: Integrate industry-standard models into your curriculum or academic research focused on Eagle Materials Inc. (EXP).
- Investors: Validate your investment theories and evaluate valuation scenarios for Eagle Materials Inc. (EXP).
- Analysts: Enhance your analysis process with a customizable DCF model tailored for Eagle Materials Inc. (EXP).
- Small Business Owners: Understand the analytical approaches used for large public companies like Eagle Materials Inc. (EXP).
What the Template Contains
- Operating and Balance Sheet Data: Pre-filled Eagle Materials Inc. (EXP) historical data and forecasts, including revenue, EBITDA, EBIT, and capital expenditures.
- WACC Calculation: A dedicated sheet for Weighted Average Cost of Capital (WACC), including parameters like Beta, risk-free rate, and share price.
- DCF Valuation (Unlevered and Levered): Editable Discounted Cash Flow models showing intrinsic value with detailed calculations.
- Financial Statements: Pre-loaded financial statements (annual and quarterly) to support analysis.
- Key Ratios: Includes profitability, leverage, and efficiency ratios for Eagle Materials Inc. (EXP).
- Dashboard and Charts: Visual summary of valuation outputs and assumptions to analyze results easily.
Disclaimer
All information, articles, and product details provided on this website are for general informational and educational purposes only. We do not claim any ownership over, nor do we intend to infringe upon, any trademarks, copyrights, logos, brand names, or other intellectual property mentioned or depicted on this site. Such intellectual property remains the property of its respective owners, and any references here are made solely for identification or informational purposes, without implying any affiliation, endorsement, or partnership.
We make no representations or warranties, express or implied, regarding the accuracy, completeness, or suitability of any content or products presented. Nothing on this website should be construed as legal, tax, investment, financial, medical, or other professional advice. In addition, no part of this site—including articles or product references—constitutes a solicitation, recommendation, endorsement, advertisement, or offer to buy or sell any securities, franchises, or other financial instruments, particularly in jurisdictions where such activity would be unlawful.
All content is of a general nature and may not address the specific circumstances of any individual or entity. It is not a substitute for professional advice or services. Any actions you take based on the information provided here are strictly at your own risk. You accept full responsibility for any decisions or outcomes arising from your use of this website and agree to release us from any liability in connection with your use of, or reliance upon, the content or products found herein.