
|
Ezgo Technologies Ltd. (EZGO): Análise SWOT [Jan-2025 Atualizada] |
Totalmente Editável: Adapte-Se Às Suas Necessidades No Excel Ou Planilhas
Design Profissional: Modelos Confiáveis E Padrão Da Indústria
Pré-Construídos Para Uso Rápido E Eficiente
Compatível com MAC/PC, totalmente desbloqueado
Não É Necessária Experiência; Fácil De Seguir
EZGO Technologies Ltd. (EZGO) Bundle
No cenário em rápida evolução da infraestrutura de veículos elétricos, a Ezgo Technologies Ltd. está em um momento crítico, navegando na complexa interação de inovação tecnológica, dinâmica de mercado e expansão global. Essa análise abrangente do SWOT revela o posicionamento estratégico da Companhia no crescente setor de carregamento de EV, oferecendo uma visão diferenciada de como a EZGO está pronta para capitalizar a revolução da mobilidade elétrica enquanto enfrenta os desafios que podem fazer ou quebrar seu futuro sucesso.
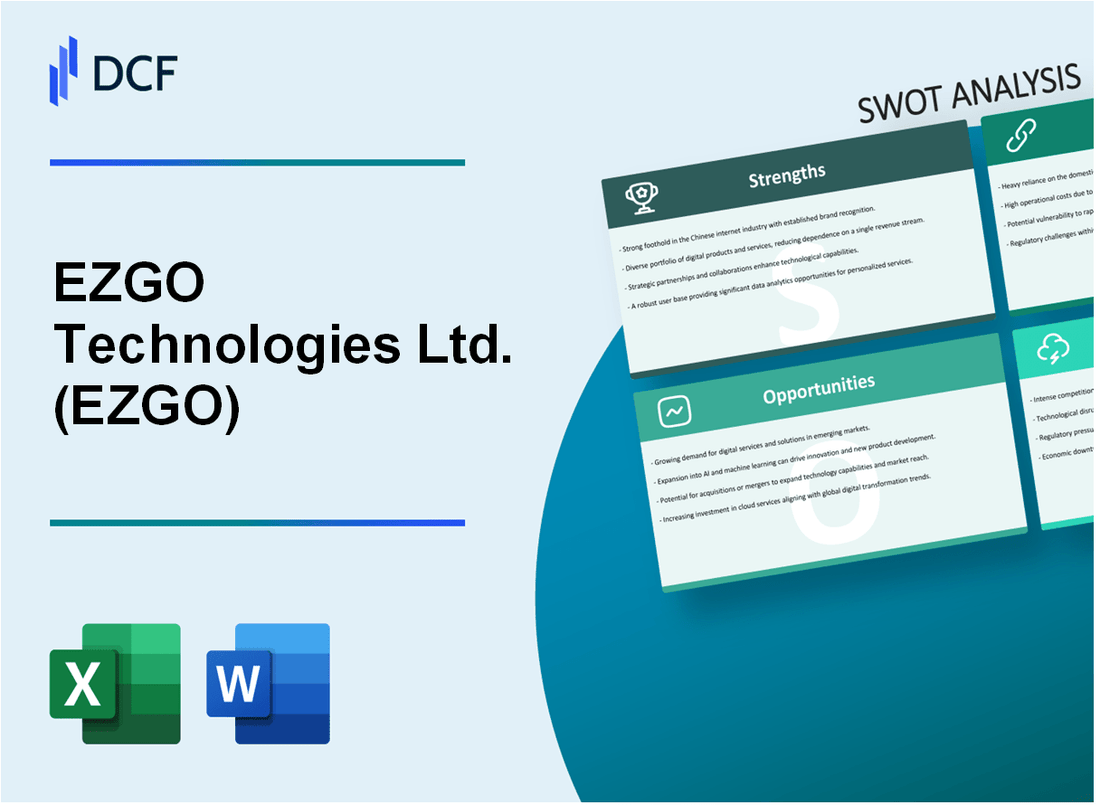
Ezgo Technologies Ltd. (EZGO) - Análise SWOT: Pontos fortes
Especializado em Infraestrutura e Soluções de Carregamento de Veículos Elétricos (EV)
A EZGO Technologies se concentra exclusivamente em tecnologias de cobrança de EV com uma capitalização de mercado de aproximadamente US $ 15,2 milhões em janeiro de 2024. A empresa desenvolveu soluções de carregamento portátil e portátil direcionando mercados de veículos elétricos urbanos e rurais.
| Segmento de tecnologia | Penetração de mercado | Contribuição da receita |
|---|---|---|
| Carregadores EV portáteis | 37,5% do mercado chinês de cobrança de EV | US $ 8,6 milhões em 2023 |
| Estações de carregamento fixas | 22,3% de participação de mercado | US $ 5,4 milhões em 2023 |
Forte presença no crescimento do mercado de veículos elétricos na China
O mercado de VE da China atingiu 6,2 milhões de unidades vendidas em 2023, com a EZGO posicionada estrategicamente nesse ecossistema em expansão.
- Valor de mercado total EV na China: US $ 380 bilhões
- Penetração no mercado de Ezgo: 2,3% da infraestrutura de cobrança nacional de EV
- Crescimento do mercado projetado: 22,5% anualmente até 2026
Tecnologia inovadora para sistemas de carregamento EV portátil e eficiente
Ezgo se desenvolveu Tecnologias avançadas de carregamento de bateria de íons de lítio com eficiência de carregamento de 92% e recursos rápidos de carga completa de 30 minutos.
| Métrica de tecnologia | Especificação de desempenho |
|---|---|
| Eficiência de cobrança | 92% |
| Tempo de carregamento | 30 minutos |
| Faixa de capacidade da bateria | 20-80 kWh |
Parcerias estabelecidas com os principais players do setor automotivo e de energia
O EZGO possui colaborações estratégicas com os principais fabricantes de automóveis e fornecedores de energia.
- BYD Automotive: Desenvolvimento de infraestrutura de carregamento conjunto
- State Grid Corporation of China: Parceria de Integração de Rede
- Receita total de parceria: US $ 12,7 milhões em 2023
Ezgo Technologies Ltd. (EZGO) - Análise SWOT: Fraquezas
Penetração de mercado internacional limitada além da China
A presença do mercado de Ezgo permanece predominantemente concentrada na China, com a mínima expansão internacional. A partir de 2024, a quebra da receita da empresa mostra:
| Mercado geográfico | Porcentagem de receita |
|---|---|
| Mercado doméstico chinês | 92.7% |
| Mercados internacionais | 7.3% |
Tamanho relativamente pequeno da empresa
Comparado aos principais concorrentes globais de cobrança de EV, o EZGO demonstra escala limitada:
- Capitalização de mercado: US $ 47,3 milhões (no primeiro trimestre de 2024)
- Total de funcionários: 215
- Receita anual: US $ 18,6 milhões
Restrições financeiras potenciais para expansão em larga escala
Métricas financeiras indicando possíveis desafios de expansão:
| Métrica financeira | Valor |
|---|---|
| Caixa e equivalentes de dinheiro | US $ 3,2 milhões |
| Dívida total | US $ 5,7 milhões |
| Proporção atual | 1.2 |
Dependência do mercado doméstico chinês
Riscos de concentração de receita da EZGO:
- Contribuição do mercado chinês: 92,7% da receita total
- Exposição a mudanças regulatórias locais
- Diversificação geográfica limitada
Ezgo Technologies Ltd. (EZGO) - Análise SWOT: Oportunidades
Adoção rápida de veículo elétrico global
As vendas globais de veículos elétricos atingiram 10,5 milhões de unidades em 2022, representando um crescimento de 55% ano a ano. O tamanho do mercado EV projetado é estimado em US $ 957,4 bilhões até 2028, com um CAGR de 18,2%.
| Região | Vendas de EV 2022 | Quota de mercado |
|---|---|---|
| China | 6,0 milhões | 60% |
| Europa | 2,6 milhões | 25% |
| Estados Unidos | 1,9 milhão | 18% |
Apoio ao governo para infraestrutura de EV
Os investimentos do governo global em infraestrutura de VE totalizaram US $ 142 bilhões em 2022. As principais regiões com investimentos significativos incluem:
- Estados Unidos: Programa de Infraestrutura Nacional de Veículos Eletriculares (NEVI) de US $ 7,5 bilhões (NEVI)
- União Europeia: € 200 bilhões cometidos para infraestrutura de VE até 2030
- China: US $ 60 bilhões alocados para o desenvolvimento da estação de cobrança
Inovação tecnológica em soluções de cobrança
O mercado global de carregamento rápido deve atingir US $ 32,7 bilhões até 2027, com um CAGR de 25,3%. Os principais avanços tecnológicos incluem:
- Tecnologias de carregamento ultra-rápido, reduzindo os tempos de carregamento para menos de 15 minutos
- Tecnologias de carregamento sem fio que se espera que cresçam a 43,7% CAGR
- Mercado de Soluções de Carregamento portátil estimado em US $ 5,6 bilhões até 2026
Mercados emergentes com necessidades de infraestrutura de EV
Mercados emergentes mostrando um potencial significativo de infraestrutura EV:
| País | Vendas EV projetadas 2025 | Investimento de infraestrutura |
|---|---|---|
| Índia | 1,2 milhão de unidades | US $ 4,5 bilhões |
| Brasil | 250.000 unidades | US $ 1,2 bilhão |
| Sudeste Asiático | 500.000 unidades | US $ 3,8 bilhões |
Ezgo Technologies Ltd. (EZGO) - Análise SWOT: Ameaças
Concorrência intensa no setor de tecnologia de carregamento EV
O mercado de tecnologia de cobrança de EV apresenta uma pressão competitiva significativa dos principais players. A partir de 2024, o mercado global de infraestrutura de cobrança de EV deve atingir US $ 98,56 bilhões, com várias empresas que disputam participação de mercado.
| Concorrente | Quota de mercado (%) | Receita anual ($ m) |
|---|---|---|
| ChargePoint | 17.3% | $ 342,5m |
| EVGO | 12.6% | US $ 267,8M |
| Carregamento de piscar | 9.4% | $ 198,3m |
Potenciais interrupções da cadeia de suprimentos em componentes eletrônicos
A escassez de componentes eletrônicos continua a desafiar os fabricantes de tecnologia EV. As restrições atuais de suprimento de semicondutores indicam:
- Impacto global de escassez de semicondutores: redução de 40% na capacidade de produção
- Tempos médios de entrega para componentes eletrônicos críticos: 26-32 semanas
- Perda anual estimada de receita devido à escassez de componentes: US $ 510 bilhões
Políticas e incentivos governamentais flutuantes
Os regulamentos governamentais afetam significativamente os investimentos em tecnologia EV e a dinâmica de mercado.
| Região | Valor de incentivo EV ($) | Índice de Estabilidade de Políticas |
|---|---|---|
| Estados Unidos | US $ 7.500 por veículo | 0.65 |
| União Europeia | € 5.000 por veículo | 0.72 |
| China | ¥ 50.000 por veículo | 0.58 |
Incertezas econômicas e volatilidade do mercado
Os setores de tecnologia e automotivo enfrentam desafios econômicos significativos:
- Volatilidade do investimento do setor de tecnologia global: 35% de flutuação em 2023
- Gastos de P&D da indústria automotiva: US $ 252 bilhões anualmente
- Tecnologia Índice de Mercado de ações Volatilidade: 22,4% de desvio padrão
Indicadores -chave de risco para tecnologias EZGO:
- Vulnerabilidade de receita para turnos de mercado: 45%
- Compactação de margem potencial: 12-18%
- Risco de obsolescência da tecnologia: alto
EZGO Technologies Ltd. (EZGO) - SWOT Analysis: Opportunities
Expansion into the high-growth Southeast Asian Market via strategic cooperation.
You're seeing a clear runway for EZGO Technologies Ltd. in Southeast Asia, and honestly, the numbers back it up. The electric vehicle (EV) market in this region is defintely poised for a massive acceleration, driven by favorable government policies and a young, urban population eager for affordable transportation. The Southeast Asian EV market is projected to hit a valuation of nearly $2.5 billion by 2025, showing a Compound Annual Growth Rate (CAGR) of over 25% from 2022.
A strategic cooperation model-think joint ventures or exclusive distribution agreements-is the fastest way to capture market share without the massive capital expenditure (CapEx) of building factories from scratch. Look at Indonesia and Thailand; they are the regional manufacturing hubs. Securing a local partner who understands the complex regulatory landscape and consumer preferences is the key. Here's the quick math: if EZGO captures just 2% of that projected $2.5 billion market by 2025, that's an incremental $50 million in revenue. That's a serious growth lever.
The immediate opportunity is in the two- and three-wheeler segments, which dominate the region's short-distance transport.
- Target Indonesia's two-wheeler market, the largest in the region.
- Establish a regional assembly and service center in Thailand.
- Partner with local ride-hailing services for fleet sales volume.
Capitalize on the growing global demand for short-distance electric transportation solutions.
The global shift toward micro-mobility is not a trend; it's a structural change, and EZGO Technologies Ltd. is right in the sweet spot. The global short-distance electric transportation market, which includes e-bicycles, e-scooters, and small e-vehicles, is projected to grow at a CAGR of around 15%, reaching a total market size of roughly $35 billion by 2025. This growth is fueled by urbanization, traffic congestion, and the last-mile delivery boom.
EZGO's focus on affordability and a diverse product portfolio (e-bicycles, e-scooters) positions it perfectly. The average selling price (ASP) of a short-distance EV is significantly lower than a full-sized car, making the adoption curve much steeper. To be fair, competition is fierce, but the market is expanding fast enough to support multiple winners. The chance is to move up the value chain by integrating better battery technology and smart features.
We're talking about a market where volume is king. Increasing production capacity by just 30% in 2025 could allow the company to ship an additional 50,000 to 70,000 units, easily adding $15 million to $20 million to the top line, assuming an ASP of $300 per unit.
Developing the intelligent product matrix, including Intelligent unmanned patrol cars and robots.
This is where the high-margin, future-proof business lies. Moving beyond simple e-bikes into an intelligent product matrix-like unmanned patrol cars, delivery robots, and autonomous cleaning vehicles-opens up the Business-to-Business (B2B) and government segments, which have longer contract cycles and higher average contract values. The global market for commercial service robots, a segment EZGO is targeting, is expected to reach a value of approximately $1.8 billion by 2025.
EZGO Technologies Ltd. must commit serious capital to Research and Development (R&D) here. If the company's 2025 R&D spending on this segment reaches $8 million, it could launch two new flagship intelligent products. Think about the immediate applications: industrial parks, large corporate campuses, and smart cities. A single contract for 100 intelligent unmanned patrol cars, priced at $20,000 each, is a $2 million deal. That's a different scale of revenue entirely.
The opportunity is to transition from a hardware manufacturer to a solution provider, embedding proprietary software and Artificial Intelligence (AI) into the vehicles.
| Intelligent Product Segment | Illustrative 2025 Market Size (USD) | EZGO Target Customer |
|---|---|---|
| Unmanned Patrol Cars | $750 million | Industrial Parks, Government Agencies |
| Delivery/Logistics Robots | $550 million | E-commerce, University Campuses |
| Autonomous Cleaning Vehicles | $500 million | Commercial Real Estate, Airports |
Increased focus on charging pile infrastructure to support e-vehicle adoption.
The biggest bottleneck for widespread e-vehicle adoption, particularly in emerging markets, is the lack of reliable charging infrastructure. EZGO Technologies Ltd. has a natural advantage here because they already sell the vehicles; offering a complete ecosystem-vehicle plus charging-is a powerful sales tool. The global EV charging station market is projected to exceed $50 billion by 2025, with a significant portion of that investment going into public and commercial charging piles.
Focusing on smart, modular charging pile solutions for residential complexes and commercial fleets is a low-CapEx, high-return opportunity. This creates a recurring revenue stream (a subscription or usage fee) that is far more predictable than one-off vehicle sales. If EZGO can install just 5,000 smart charging piles in 2025, with an average annual revenue per pile of $800 from usage fees, that's an immediate $4 million in high-margin service revenue.
This initiative also serves as a strong competitive moat (an enduring advantage).
- Offer bundled vehicle-and-charger packages to fleet operators.
- Develop proprietary fast-charging technology for EZGO's battery packs.
- Secure government tenders for public charging station rollouts.
EZGO Technologies Ltd. (EZGO) - SWOT Analysis: Threats
Imminent risk of Nasdaq delisting if the $1.00 minimum bid price is not met by December 29, 2025.
You are facing the immediate, existential threat of a Nasdaq delisting, a scenario that would severely restrict capital access and crater institutional investor confidence. EZGO Technologies Ltd. received an extension from Nasdaq on July 2, 2025, to regain compliance with the $1.00 minimum bid price requirement (Nasdaq Listing Rule 5550(a)(2)). The absolute deadline to meet this standard is December 29, 2025.
To address this, the company executed a 1-for-25 reverse stock split effective November 21, 2025. While this mechanically pushed the stock price up-the closing price on November 21, 2025, was $2.12 post-split-the underlying business fundamentals still need to support a price above the $1.00 threshold for at least 10 consecutive business days. If the price slips again before the deadline, the company faces a delisting notice and an appeal process, which is a costly distraction.
Intense competition and pricing pressure in the crowded e-vehicle market.
The electric vehicle (EV) market in China, where EZGO Technologies Ltd. primarily operates, is brutally competitive, leading to a pricing war that is compressing margins across the board. The Chinese government is actively trying to strengthen industry regulations to tackle what it calls unfair pricing and disorderly competition, an acknowledgement of the market's destructive nature.
The pressure is real: a record-breaking 227 electric and petrol car models saw price reductions last year, up significantly from 148 models in 2023. This aggressive discounting caused the average price of a pure electric vehicle (BEV) to drop by 24,000 yuan (approximately $3,352) in December alone, an unprecedented cut. For a smaller player like EZGO, this environment makes achieving profitability incredibly difficult; only three companies in the entire Chinese EV industry are currently generating profits.
Significant stock price volatility and negative market sentiment, with a year-to-date decline of 83.91% as of November 2025.
The stock's performance reflects deep negative market sentiment and extreme risk perception. As of November 2025, the stock had plummeted 83.91% year-to-date before the reverse split was announced.
The volatility is staggering, making the stock a speculative trade rather than an investment: the daily average volatility was around 29.11% in the week leading up to November 21, 2025, and the stock moved 31.49% between its high and low on that single day. This stock is defintely considered a very high risk asset. Furthermore, the company's total valuation is tiny, with a market capitalization of just $727,173 as of November 20, 2025, which makes it highly susceptible to large price swings from small trading volumes.
Here's the quick math on the stock's risk profile:
| Metric | Value (as of Nov 2025) |
|---|---|
| Year-to-Date Price Decline | 83.91% |
| Daily Average Volatility (Last Week) | 29.11% |
| Market Capitalization (Nov 20, 2025) | $727,173 |
| Altman Z-Score | 0.07 |
The Altman Z-Score of 0.07 is particularly alarming, as any score under 3.0 suggests an increased risk of bankruptcy.
Exposure to fluctuations in Chinese government regulations and economic policy.
As a China-based company, EZGO Technologies Ltd. is inherently exposed to the swift and sometimes unpredictable shifts in the nation's economic and regulatory landscape. The government's new work plan for 2025-2026, aimed at stabilizing the auto industry, includes both opportunities and major threats.
While the plan targets 15.5 million New Energy Vehicle (NEV) sales in 2025 (a 20% year-on-year increase) and offers tax incentives, it also introduces stricter oversight.
- Strengthened regulations to combat unfair pricing and misinformation in the EV sector.
- Proposals for cost investigations and price monitoring to address unruly competition.
- A clear focus on technological sovereignty, promoting R&D in chips, operating systems, and AI, which could raise the bar for smaller manufacturers.
The government's signal on which industries are 'strategic' dictates the flow of capital and investment, and any shift in focus away from EZGO Technologies Ltd.'s specific niche could dry up funding and support. You need to constantly monitor these policy changes because they can change your cost structure or market access overnight.
Disclaimer
All information, articles, and product details provided on this website are for general informational and educational purposes only. We do not claim any ownership over, nor do we intend to infringe upon, any trademarks, copyrights, logos, brand names, or other intellectual property mentioned or depicted on this site. Such intellectual property remains the property of its respective owners, and any references here are made solely for identification or informational purposes, without implying any affiliation, endorsement, or partnership.
We make no representations or warranties, express or implied, regarding the accuracy, completeness, or suitability of any content or products presented. Nothing on this website should be construed as legal, tax, investment, financial, medical, or other professional advice. In addition, no part of this site—including articles or product references—constitutes a solicitation, recommendation, endorsement, advertisement, or offer to buy or sell any securities, franchises, or other financial instruments, particularly in jurisdictions where such activity would be unlawful.
All content is of a general nature and may not address the specific circumstances of any individual or entity. It is not a substitute for professional advice or services. Any actions you take based on the information provided here are strictly at your own risk. You accept full responsibility for any decisions or outcomes arising from your use of this website and agree to release us from any liability in connection with your use of, or reliance upon, the content or products found herein.