
|
FD Technologies PLC (FDP.L) Avaliação DCF |
Totalmente Editável: Adapte-Se Às Suas Necessidades No Excel Ou Planilhas
Design Profissional: Modelos Confiáveis E Padrão Da Indústria
Pré-Construídos Para Uso Rápido E Eficiente
Compatível com MAC/PC, totalmente desbloqueado
Não É Necessária Experiência; Fácil De Seguir
FD Technologies Plc (FDP.L) Bundle
Otimize seu tempo e melhore a precisão com a nossa calculadora DCF (FDPL)! Utilizando dados reais da FD Technologies PLC e entradas personalizáveis, essa ferramenta capacita você a prever, analisar e avaliar a FD Technologies PLC como um investidor experiente.
Discounted Cash Flow (DCF) - (USD MM)
| Year | AY1 2019 |
AY2 2020 |
AY3 2021 |
AY4 2022 |
AY5 2023 |
FY1 2024 |
FY2 2025 |
FY3 2026 |
FY4 2027 |
FY5 2028 |
|---|---|---|---|---|---|---|---|---|---|---|
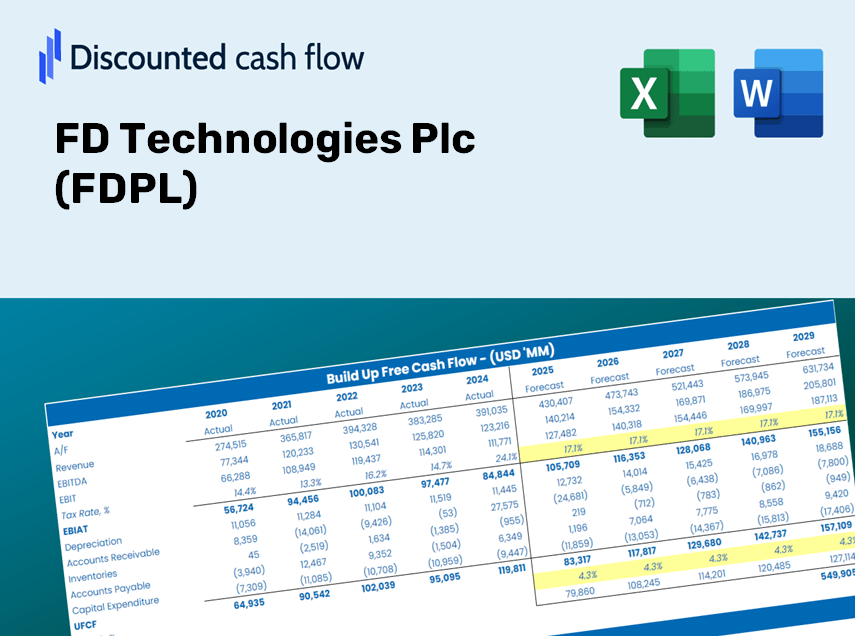
| Revenue | 237.8 | 237.9 | 263.5 | 296.0 | 248.9 | 253.4 | 257.9 | 262.6 | 267.3 | 272.2 |
| Revenue Growth, % | 0 | 0.03238151 | 10.76 | 12.37 | -15.94 | 1.81 | 1.81 | 1.81 | 1.81 | 1.81 |
| EBITDA | 40.1 | 34.0 | 29.8 | 23.4 | 15.0 | 28.6 | 29.1 | 29.6 | 30.2 | 30.7 |
| EBITDA, % | 16.88 | 14.28 | 11.29 | 7.92 | 6.02 | 11.28 | 11.28 | 11.28 | 11.28 | 11.28 |
| Depreciation | 18.7 | 19.8 | 20.1 | 21.6 | 21.6 | 20.2 | 20.5 | 20.9 | 21.3 | 21.7 |
| Depreciation, % | 7.85 | 8.31 | 7.64 | 7.29 | 8.69 | 7.96 | 7.96 | 7.96 | 7.96 | 7.96 |
| EBIT | 21.5 | 14.2 | 9.6 | 1.8 | -6.7 | 8.4 | 8.6 | 8.7 | 8.9 | 9.0 |
| EBIT, % | 9.03 | 5.97 | 3.66 | 0.62424 | -2.67 | 3.32 | 3.32 | 3.32 | 3.32 | 3.32 |
| Total Cash | 26.1 | 55.2 | 48.6 | 36.9 | 20.8 | 37.2 | 37.9 | 38.6 | 39.3 | 40.0 |
| Total Cash, percent | .0 | .0 | .0 | .0 | .0 | .0 | .0 | .0 | .0 | .0 |
| Account Receivables | .0 | .0 | .0 | .0 | 58.1 | 11.8 | 12.0 | 12.3 | 12.5 | 12.7 |
| Account Receivables, % | 0 | 0 | 0 | 0 | 23.36 | 4.67 | 4.67 | 4.67 | 4.67 | 4.67 |
| Inventories | .0 | .0 | .0 | .0 | .0 | .0 | .0 | .0 | .0 | .0 |
| Inventories, % | 0 | 0 | 0 | 0 | 0 | 0 | 0 | 0 | 0 | 0 |
| Accounts Payable | 7.7 | 9.0 | 12.8 | 11.3 | 8.0 | 9.6 | 9.8 | 10.0 | 10.1 | 10.3 |
| Accounts Payable, % | 3.25 | 3.8 | 4.87 | 3.81 | 3.22 | 3.79 | 3.79 | 3.79 | 3.79 | 3.79 |
| Capital Expenditure | -13.3 | -15.3 | -21.7 | -26.4 | -27.9 | -20.5 | -20.8 | -21.2 | -21.6 | -22.0 |
| Capital Expenditure, % | -5.58 | -6.42 | -8.24 | -8.92 | -11.2 | -8.07 | -8.07 | -8.07 | -8.07 | -8.07 |
| Tax Rate, % | -426.52 | -426.52 | -426.52 | -426.52 | -426.52 | -426.52 | -426.52 | -426.52 | -426.52 | -426.52 |
| EBITAT | 19.0 | 12.8 | 9.4 | 2.2 | -35.0 | 8.0 | 8.1 | 8.3 | 8.4 | 8.6 |
| Depreciation | ||||||||||
| Changes in Account Receivables | ||||||||||
| Changes in Inventories | ||||||||||
| Changes in Accounts Payable | ||||||||||
| Capital Expenditure | ||||||||||
| UFCF | 32.2 | 18.6 | 11.6 | -4.2 | -102.7 | 55.6 | 7.8 | 8.0 | 8.1 | 8.2 |
| WACC, % | 7.07 | 7.07 | 7.11 | 7.13 | 7.13 | 7.1 | 7.1 | 7.1 | 7.1 | 7.1 |
| PV UFCF | ||||||||||
| SUM PV UFCF | 77.2 | |||||||||
| Long Term Growth Rate, % | 4.00 | |||||||||
| Free cash flow (T + 1) | 9 | |||||||||
| Terminal Value | 276 | |||||||||
| Present Terminal Value | 196 | |||||||||
| Enterprise Value | 273 | |||||||||
| Net Debt | 26 | |||||||||
| Equity Value | 248 | |||||||||
| Diluted Shares Outstanding, MM | 28 | |||||||||
| Equity Value Per Share | 881.91 |
What You Will Receive
- Authentic FD Technologies Data: Comprehensive financials – from revenue to EBIT – incorporating actual and forecasted data.
- Comprehensive Customization: Modify essential parameters (highlighted in yellow) such as WACC, growth %, and tax rates.
- Immediate Valuation Updates: Automatic recalculations to assess the effects of changes on FD Technologies' fair value.
- Flexible Excel Template: Designed for quick modifications, scenario analysis, and in-depth projections.
- Efficient and Accurate: Eliminate the need to create models from scratch while ensuring precision and adaptability.
Key Features
- Real-Time FDPL Data: Automatically populated with FD Technologies Plc's historical financial records and future forecasts.
- Comprehensive Customization Options: Tailor revenue growth, profit margins, WACC, tax rates, and capital expenditure settings to your needs.
- Interactive Valuation Model: Instant updates to Net Present Value (NPV) and intrinsic value driven by your specified parameters.
- Scenario Analysis: Develop various predictive scenarios to evaluate different valuation projections.
- Intuitive User Interface: Clear, organized design suitable for both seasoned professionals and newcomers.
How It Works
- 1. Access the Template: Download and open the Excel file containing FD Technologies Plc's (FDPL) preloaded data.
- 2. Modify Assumptions: Adjust key inputs such as growth rates, WACC, and capital expenditures.
- 3. Review Results Instantly: The DCF model automatically calculates intrinsic value and NPV for FD Technologies Plc (FDPL).
- 4. Explore Scenarios: Analyze different valuation outcomes by comparing multiple forecasts.
- 5. Present with Confidence: Share professional valuation insights to inform your decision-making for FD Technologies Plc (FDPL).
Why Opt for This Calculator?
- User-Friendly Interface: Crafted for both novices and seasoned professionals.
- Customizable Inputs: Easily adjust parameters to suit your financial analysis.
- Real-Time Updates: Instantly view changes in FD Technologies Plc’s valuation as you modify inputs.
- Preloaded Data: Comes equipped with FD Technologies Plc’s actual financial data for swift assessments.
- Endorsed by Industry Experts: Utilized by investors and analysts for making well-informed choices.
Who Can Benefit from This Product?
- Individual Investors: Make informed choices regarding the purchase or sale of FD Technologies Plc (FDPL) shares.
- Financial Analysts: Enhance valuation workflows with ready-to-apply financial models specific to FD Technologies Plc (FDPL).
- Consultants: Provide clients with swift and accurate valuation analysis for FD Technologies Plc (FDPL).
- Business Owners: Gain insights into the valuation of large firms like FD Technologies Plc (FDPL) to inform your own business strategy.
- Finance Students: Explore valuation methods using real data and scenarios related to FD Technologies Plc (FDPL).
Contents of the Template
- Pre-Filled DCF Model: FD Technologies Plc's (FDPL) financial data readily available for immediate application.
- WACC Calculator: Comprehensive calculations for the Weighted Average Cost of Capital.
- Financial Ratios: Assess FD Technologies Plc's (FDPL) profitability, leverage, and operational efficiency.
- Editable Inputs: Modify assumptions like growth rates, profit margins, and capital expenditures to suit your analysis.
- Financial Statements: Access annual and quarterly reports for in-depth financial evaluation.
- Interactive Dashboard: Effortlessly visualize essential valuation metrics and outcomes.
Disclaimer
All information, articles, and product details provided on this website are for general informational and educational purposes only. We do not claim any ownership over, nor do we intend to infringe upon, any trademarks, copyrights, logos, brand names, or other intellectual property mentioned or depicted on this site. Such intellectual property remains the property of its respective owners, and any references here are made solely for identification or informational purposes, without implying any affiliation, endorsement, or partnership.
We make no representations or warranties, express or implied, regarding the accuracy, completeness, or suitability of any content or products presented. Nothing on this website should be construed as legal, tax, investment, financial, medical, or other professional advice. In addition, no part of this site—including articles or product references—constitutes a solicitation, recommendation, endorsement, advertisement, or offer to buy or sell any securities, franchises, or other financial instruments, particularly in jurisdictions where such activity would be unlawful.
All content is of a general nature and may not address the specific circumstances of any individual or entity. It is not a substitute for professional advice or services. Any actions you take based on the information provided here are strictly at your own risk. You accept full responsibility for any decisions or outcomes arising from your use of this website and agree to release us from any liability in connection with your use of, or reliance upon, the content or products found herein.