
|
Avaliação DCF da FedEx Corporation (FDX) |
Totalmente Editável: Adapte-Se Às Suas Necessidades No Excel Ou Planilhas
Design Profissional: Modelos Confiáveis E Padrão Da Indústria
Pré-Construídos Para Uso Rápido E Eficiente
Compatível com MAC/PC, totalmente desbloqueado
Não É Necessária Experiência; Fácil De Seguir
FedEx Corporation (FDX) Bundle
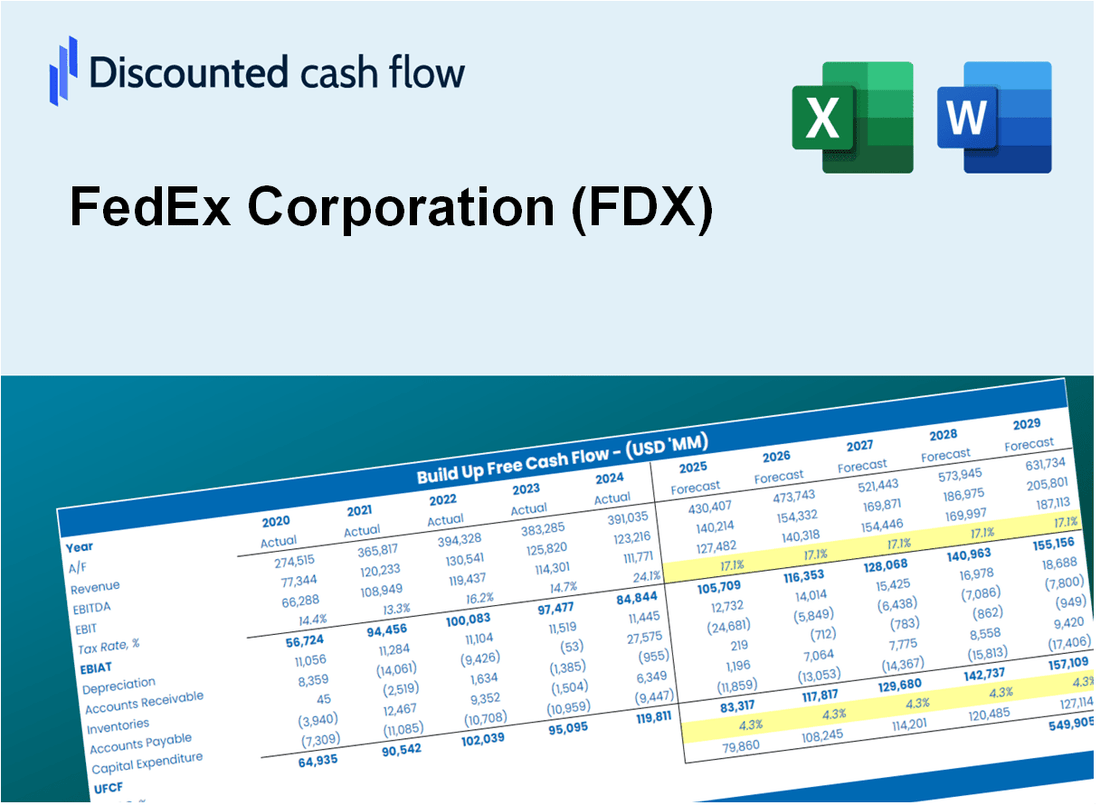
Obtenha informações profissionais sobre o futuro financeiro da FedEx Corporation (FDX)! Esta calculadora DCF (FDX) vem com dados financeiros pré-preenchidos e oferece a flexibilidade para modificar o crescimento da receita, o WACC, as margens e outras suposições cruciais para se alinhar às suas projeções.
What You Will Get
- Real FDX Financials: Access to historical and projected data for precise valuation.
- Customizable Inputs: Adjust WACC, tax rates, revenue growth, and capital expenditures as needed.
- Automatic Calculations: Intrinsic value and NPV are computed in real-time.
- Scenario Analysis: Explore various scenarios to assess FedEx's future performance.
- User-Friendly Design: Designed for experts but easy for newcomers to navigate.
Key Features
- Accurate FedEx Financials: Gain access to reliable pre-loaded historical data and future estimates.
- Adjustable Forecast Parameters: Modify highlighted cells for metrics such as WACC, growth rates, and profit margins.
- Real-Time Calculations: Automatic recalculations for DCF, Net Present Value (NPV), and cash flow assessments.
- User-Friendly Dashboard: Clear charts and summaries to help visualize your valuation outcomes.
- Designed for All Users: An intuitive layout suitable for investors, CFOs, and consultants alike.
How It Works
- Download the Template: Get instant access to the Excel-based FDX DCF Calculator.
- Input Your Assumptions: Adjust yellow-highlighted cells for growth rates, WACC, margins, and more.
- Instant Calculations: The model automatically updates FedEx’s intrinsic value.
- Test Scenarios: Simulate different assumptions to evaluate potential valuation changes.
- Analyze and Decide: Use the results to guide your investment or financial analysis.
Why Choose This Calculator for FedEx Corporation (FDX)?
- Accurate Data: Up-to-date FedEx financials provide dependable valuation outcomes.
- Customizable: Tailor essential variables such as growth rates, WACC, and tax rates to fit your forecasts.
- Time-Saving: Built-in calculations mean you won’t have to start from the ground up.
- Professional-Grade Tool: Crafted for investors, analysts, and consultants in the logistics sector.
- User-Friendly: Easy-to-navigate design and clear instructions ensure accessibility for all users.
Who Should Use This Product?
- Professional Investors: Develop comprehensive and accurate valuation models for assessing FedEx Corporation (FDX) investments.
- Corporate Finance Teams: Evaluate valuation scenarios to inform strategic decisions within the organization.
- Consultants and Advisors: Deliver precise valuation insights to clients regarding FedEx Corporation (FDX) stock.
- Students and Educators: Utilize real-world data to enhance learning and practice in financial modeling.
- Logistics Enthusiasts: Gain insights into how logistics companies like FedEx Corporation (FDX) are valued in the marketplace.
What the Template Contains
- Preloaded FDX Data: Historical and projected financial data, including revenue, EBIT, and capital expenditures.
- DCF and WACC Models: Professional-grade sheets for calculating intrinsic value and Weighted Average Cost of Capital.
- Editable Inputs: Yellow-highlighted cells for adjusting revenue growth, tax rates, and discount rates.
- Financial Statements: Comprehensive annual and quarterly financials for deeper analysis.
- Key Ratios: Profitability, leverage, and efficiency ratios to evaluate performance.
- Dashboard and Charts: Visual summaries of valuation outcomes and assumptions.
Disclaimer
All information, articles, and product details provided on this website are for general informational and educational purposes only. We do not claim any ownership over, nor do we intend to infringe upon, any trademarks, copyrights, logos, brand names, or other intellectual property mentioned or depicted on this site. Such intellectual property remains the property of its respective owners, and any references here are made solely for identification or informational purposes, without implying any affiliation, endorsement, or partnership.
We make no representations or warranties, express or implied, regarding the accuracy, completeness, or suitability of any content or products presented. Nothing on this website should be construed as legal, tax, investment, financial, medical, or other professional advice. In addition, no part of this site—including articles or product references—constitutes a solicitation, recommendation, endorsement, advertisement, or offer to buy or sell any securities, franchises, or other financial instruments, particularly in jurisdictions where such activity would be unlawful.
All content is of a general nature and may not address the specific circumstances of any individual or entity. It is not a substitute for professional advice or services. Any actions you take based on the information provided here are strictly at your own risk. You accept full responsibility for any decisions or outcomes arising from your use of this website and agree to release us from any liability in connection with your use of, or reliance upon, the content or products found herein.