
|
Fidelis Insurance Holdings Limited (FIHL) Avaliação DCF |
Totalmente Editável: Adapte-Se Às Suas Necessidades No Excel Ou Planilhas
Design Profissional: Modelos Confiáveis E Padrão Da Indústria
Pré-Construídos Para Uso Rápido E Eficiente
Compatível com MAC/PC, totalmente desbloqueado
Não É Necessária Experiência; Fácil De Seguir
Fidelis Insurance Holdings Limited (FIHL) Bundle
Avaliação da Streamline Fidelis Insurance Holdings Limited (FIHL) usando esta calculadora DCF versátil! Com dados financeiros da Real Fidelis Insurance Holdings Limited (FIHL) e insumos de previsão personalizáveis, você pode explorar vários cenários e determinar o valor justo da Fidelis Insurance Holdings Limited (FIHL) em apenas alguns minutos.
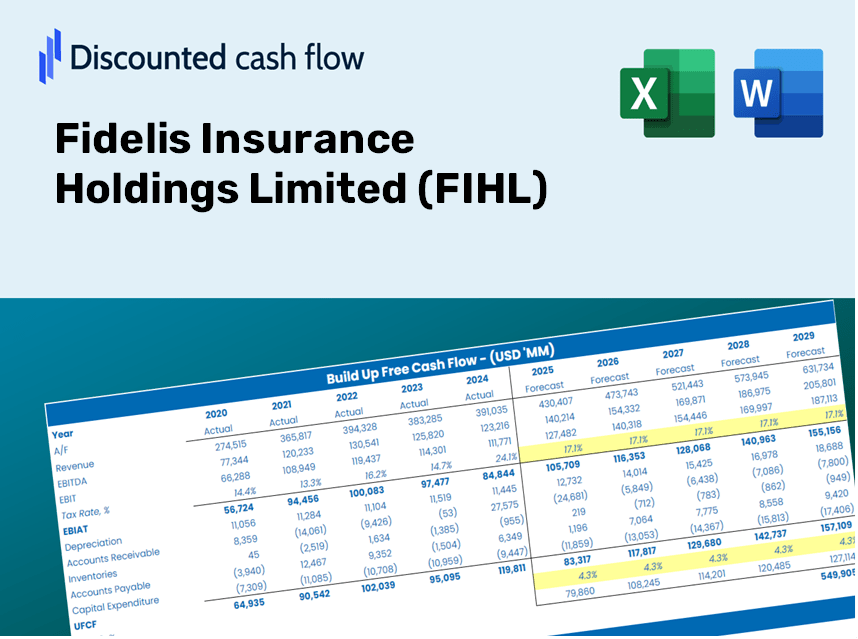
Discounted Cash Flow (DCF) - (USD MM)
| Year | AY1 2020 |
AY2 2021 |
AY3 2022 |
AY4 2023 |
AY5 2024 |
FY1 2025 |
FY2 2026 |
FY3 2027 |
FY4 2028 |
FY5 2029 |
|---|---|---|---|---|---|---|---|---|---|---|
| Revenue | 782.6 | 1,194.4 | 1,516.2 | 3,592.1 | 2,421.6 | 3,311.4 | 4,528.1 | 6,192.0 | 8,467.1 | 11,578.3 |
| Revenue Growth, % | 0 | 52.62 | 26.94 | 136.91 | -32.59 | 36.74 | 36.74 | 36.74 | 36.74 | 36.74 |
| EBITDA | 154.0 | 118.6 | 119.5 | 2,083.0 | 156.2 | 675.0 | 923.1 | 1,262.3 | 1,726.1 | 2,360.3 |
| EBITDA, % | 19.68 | 9.93 | 7.88 | 57.99 | 6.45 | 20.39 | 20.39 | 20.39 | 20.39 | 20.39 |
| Depreciation | 2.6 | 4.5 | 3.9 | .3 | -14.0 | 2.6 | 3.6 | 4.9 | 6.7 | 9.2 |
| Depreciation, % | 0.33223 | 0.37676 | 0.25722 | 0.00835166 | -0.57813 | 0.07928552 | 0.07928552 | 0.07928552 | 0.07928552 | 0.07928552 |
| EBIT | 151.4 | 114.1 | 115.6 | 2,082.7 | 170.2 | 672.4 | 919.5 | 1,257.4 | 1,719.4 | 2,351.1 |
| EBIT, % | 19.35 | 9.55 | 7.62 | 57.98 | 7.03 | 20.31 | 20.31 | 20.31 | 20.31 | 20.31 |
| Total Cash | 2,520.7 | 2,827.7 | 3,298.4 | 1,317.3 | 1,112.7 | 2,534.0 | 3,465.1 | 4,738.4 | 6,479.4 | 8,860.2 |
| Total Cash, percent | .0 | .0 | .0 | .0 | .0 | .0 | .0 | .0 | .0 | .0 |
| Account Receivables | 1,583.2 | 2,607.0 | 2,998.2 | .0 | 4,472.3 | 2,649.1 | 3,622.5 | 4,953.6 | 6,773.7 | 9,262.7 |
| Account Receivables, % | 202.3 | 218.27 | 197.74 | 0 | 184.68 | 80 | 80 | 80 | 80 | 80 |
| Inventories | .0 | -2,758.4 | .0 | .0 | .0 | -662.3 | -905.6 | -1,238.4 | -1,693.4 | -2,315.7 |
| Inventories, % | 0 | -230.94 | 0 | 0 | 0 | -20 | -20 | -20 | -20 | -20 |
| Accounts Payable | 507.9 | 947.8 | 1,057.0 | 1,071.5 | 1,540.6 | 2,035.9 | 2,784.0 | 3,807.0 | 5,205.9 | 7,118.7 |
| Accounts Payable, % | 64.9 | 79.35 | 69.71 | 29.83 | 63.62 | 61.48 | 61.48 | 61.48 | 61.48 | 61.48 |
| Capital Expenditure | -2.0 | -7.1 | -18.8 | -6.4 | -4.6 | -16.3 | -22.3 | -30.4 | -41.6 | -56.9 |
| Capital Expenditure, % | -0.25556 | -0.59444 | -1.24 | -0.17817 | -0.18996 | -0.49161 | -0.49161 | -0.49161 | -0.49161 | -0.49161 |
| Tax Rate, % | 16.94 | 16.94 | 16.94 | 16.94 | 16.94 | 16.94 | 16.94 | 16.94 | 16.94 | 16.94 |
| EBITAT | 155.1 | 99.0 | 75.9 | 2,169.5 | 141.4 | 585.7 | 800.9 | 1,095.2 | 1,497.6 | 2,047.9 |
| Depreciation | ||||||||||
| Changes in Account Receivables | ||||||||||
| Changes in Inventories | ||||||||||
| Changes in Accounts Payable | ||||||||||
| Capital Expenditure | ||||||||||
| UFCF | -919.6 | 2,270.9 | -2,979.4 | 5,176.1 | -3,880.4 | 3,552.9 | 800.3 | 1,094.3 | 1,496.5 | 2,046.3 |
| WACC, % | 5.43 | 5.25 | 4.97 | 5.43 | 5.2 | 5.26 | 5.26 | 5.26 | 5.26 | 5.26 |
| PV UFCF | ||||||||||
| SUM PV UFCF | 7,839.3 | |||||||||
| Long Term Growth Rate, % | 2.00 | |||||||||
| Free cash flow (T + 1) | 2,087 | |||||||||
| Terminal Value | 64,094 | |||||||||
| Present Terminal Value | 49,611 | |||||||||
| Enterprise Value | 57,450 | |||||||||
| Net Debt | -294 | |||||||||
| Equity Value | 57,744 | |||||||||
| Diluted Shares Outstanding, MM | 116 | |||||||||
| Equity Value Per Share | 499.40 |
What You Will Receive
- Authentic FIHL Financial Data: Pre-loaded with Fidelis Insurance's historical and forecasted data for accurate analysis.
- Customizable Template: Easily adjust essential inputs such as premium growth, loss ratios, and expense ratios.
- Instant Calculations: Watch the intrinsic value of Fidelis Insurance update automatically based on your modifications.
- Expert Valuation Tool: Tailored for investors, analysts, and consultants aiming for reliable DCF outcomes.
- User-Friendly Interface: Intuitive layout and straightforward guidance suitable for all levels of experience.
Key Features
- Real-Life FIHL Data: Pre-filled with Fidelis Insurance Holdings Limited's historical financials and future projections.
- Fully Customizable Inputs: Modify variables such as revenue growth, profit margins, discount rates, tax obligations, and capital investments.
- Dynamic Valuation Model: Automatically recalculates Net Present Value (NPV) and intrinsic value based on your adjustments.
- Scenario Testing: Develop various forecast scenarios to evaluate different valuation outcomes.
- User-Friendly Design: Intuitive, organized, and suitable for both industry professionals and novices.
How It Functions
- Download the Template: Gain immediate access to the Excel-based FIHL DCF Calculator.
- Input Your Assumptions: Modify the yellow-highlighted cells for growth rates, WACC, profit margins, and more.
- Instant Calculations: The model automatically recalculates the intrinsic value of Fidelis Insurance Holdings Limited (FIHL).
- Test Scenarios: Experiment with various assumptions to assess potential changes in valuation.
- Analyze and Decide: Leverage the results to inform your investment strategies or financial analyses.
Why Opt for the FIHL Calculator?
- Save Time: Skip the hassle of building a DCF model from the ground up – it’s pre-configured and ready for use.
- Enhance Accuracy: Dependable financial data and formulas minimize valuation errors.
- Completely Customizable: Adjust the model to align with your specific assumptions and forecasts.
- User-Friendly Output: Intuitive charts and results enable straightforward analysis.
- Endorsed by Professionals: Crafted for experts who prioritize precision and functionality.
Who Can Benefit from This Product?
- Investors: Assess the valuation of Fidelis Insurance Holdings Limited (FIHL) before making stock transactions.
- CFOs and Financial Analysts: Optimize valuation methods and evaluate forecasts efficiently.
- Startup Founders: Discover how leading insurance companies like Fidelis Insurance Holdings Limited (FIHL) are valued.
- Consultants: Provide clients with comprehensive and professional valuation reports.
- Students and Educators: Employ real-world examples to learn and teach valuation strategies.
Contents of the Template
- In-Depth DCF Model: An editable template featuring thorough valuation calculations.
- Market Data: Historical and projected financial information for Fidelis Insurance Holdings Limited (FIHL) included for analysis.
- Adjustable Variables: Modify WACC, growth rates, and tax assumptions to explore different scenarios.
- Financial Statements: Comprehensive annual and quarterly reports for enhanced insights.
- Essential Ratios: Integrated analysis of profitability, efficiency, and leverage ratios.
- Visual Dashboard: Graphs and tables that present clear, actionable insights.
Disclaimer
All information, articles, and product details provided on this website are for general informational and educational purposes only. We do not claim any ownership over, nor do we intend to infringe upon, any trademarks, copyrights, logos, brand names, or other intellectual property mentioned or depicted on this site. Such intellectual property remains the property of its respective owners, and any references here are made solely for identification or informational purposes, without implying any affiliation, endorsement, or partnership.
We make no representations or warranties, express or implied, regarding the accuracy, completeness, or suitability of any content or products presented. Nothing on this website should be construed as legal, tax, investment, financial, medical, or other professional advice. In addition, no part of this site—including articles or product references—constitutes a solicitation, recommendation, endorsement, advertisement, or offer to buy or sell any securities, franchises, or other financial instruments, particularly in jurisdictions where such activity would be unlawful.
All content is of a general nature and may not address the specific circumstances of any individual or entity. It is not a substitute for professional advice or services. Any actions you take based on the information provided here are strictly at your own risk. You accept full responsibility for any decisions or outcomes arising from your use of this website and agree to release us from any liability in connection with your use of, or reliance upon, the content or products found herein.