
|
Lisi S.A. (FII.PA) Avaliação DCF |
Totalmente Editável: Adapte-Se Às Suas Necessidades No Excel Ou Planilhas
Design Profissional: Modelos Confiáveis E Padrão Da Indústria
Pré-Construídos Para Uso Rápido E Eficiente
Compatível com MAC/PC, totalmente desbloqueado
Não É Necessária Experiência; Fácil De Seguir
Lisi S.A. (FII.PA) Bundle
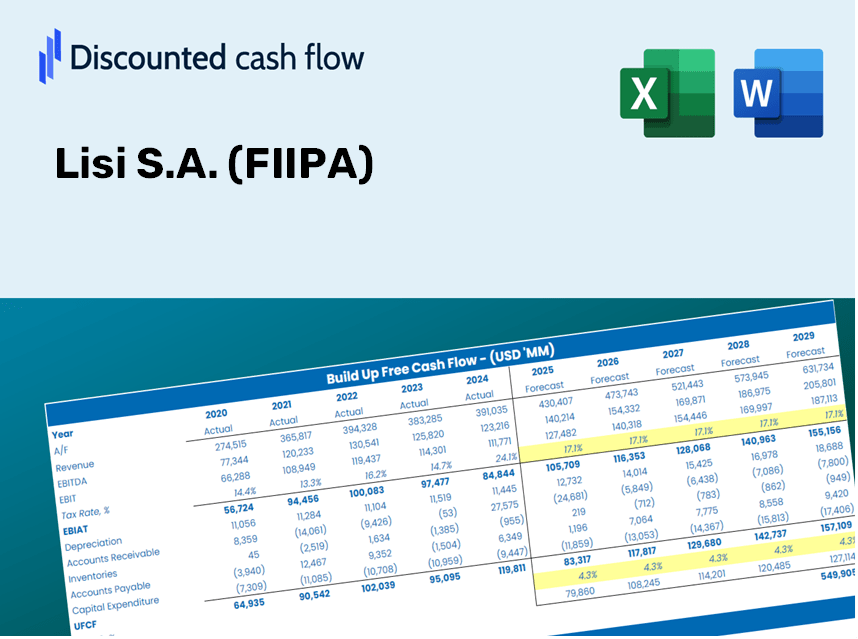
Ganhe domínio sobre sua análise de avaliação Lisi S.A. (FIIPA) usando nossa sofisticada calculadora DCF! Este modelo do Excel é pré -carregado com dados reais (FIIPA), permitindo que você ajuste as previsões e suposições para um cálculo preciso do valor intrínseco de Lisi S.A..
Discounted Cash Flow (DCF) - (USD MM)
| Year | AY1 2020 |
AY2 2021 |
AY3 2022 |
AY4 2023 |
AY5 2024 |
FY1 2025 |
FY2 2026 |
FY3 2027 |
FY4 2028 |
FY5 2029 |
|---|---|---|---|---|---|---|---|---|---|---|
| Revenue | 1,230.0 | 1,163.9 | 1,425.2 | 1,630.4 | 1,794.1 | 1,980.3 | 2,185.8 | 2,412.6 | 2,663.0 | 2,939.4 |
| Revenue Growth, % | 0 | -5.37 | 22.45 | 14.4 | 10.03 | 10.38 | 10.38 | 10.38 | 10.38 | 10.38 |
| EBITDA | 78.5 | 161.3 | 183.0 | 182.0 | 241.3 | 228.5 | 252.2 | 278.4 | 307.3 | 339.2 |
| EBITDA, % | 6.39 | 13.85 | 12.84 | 11.16 | 13.45 | 11.54 | 11.54 | 11.54 | 11.54 | 11.54 |
| Depreciation | 117.1 | 94.6 | 99.0 | 100.4 | 109.8 | 146.0 | 161.2 | 177.9 | 196.4 | 216.8 |
| Depreciation, % | 9.52 | 8.13 | 6.94 | 6.16 | 6.12 | 7.37 | 7.37 | 7.37 | 7.37 | 7.37 |
| EBIT | -38.6 | 66.6 | 84.0 | 81.7 | 131.6 | 82.5 | 91.0 | 100.5 | 110.9 | 122.4 |
| EBIT, % | -3.13 | 5.72 | 5.89 | 5.01 | 7.33 | 4.16 | 4.16 | 4.16 | 4.16 | 4.16 |
| Total Cash | 242.1 | 215.9 | 144.1 | 139.3 | 191.7 | 267.6 | 295.4 | 326.1 | 359.9 | 397.3 |
| Total Cash, percent | .0 | .0 | .0 | .0 | .0 | .0 | .0 | .0 | .0 | .0 |
| Account Receivables | 178.7 | 179.4 | 160.0 | 173.3 | 240.2 | 258.2 | 285.0 | 314.6 | 347.2 | 383.2 |
| Account Receivables, % | 14.53 | 15.41 | 11.23 | 10.63 | 13.39 | 13.04 | 13.04 | 13.04 | 13.04 | 13.04 |
| Inventories | 300.4 | 332.7 | 400.3 | 437.3 | 468.2 | 530.8 | 585.9 | 646.7 | 713.8 | 787.9 |
| Inventories, % | 24.42 | 28.59 | 28.09 | 26.82 | 26.1 | 26.8 | 26.8 | 26.8 | 26.8 | 26.8 |
| Accounts Payable | 253.8 | 241.7 | 314.0 | 356.0 | 378.6 | 421.3 | 465.0 | 513.3 | 566.5 | 625.3 |
| Accounts Payable, % | 20.64 | 20.77 | 22.03 | 21.84 | 21.1 | 21.27 | 21.27 | 21.27 | 21.27 | 21.27 |
| Capital Expenditure | -73.4 | -66.6 | -110.6 | -98.9 | -106.8 | -124.6 | -137.6 | -151.9 | -167.6 | -185.0 |
| Capital Expenditure, % | -5.97 | -5.73 | -7.76 | -6.07 | -5.95 | -6.29 | -6.29 | -6.29 | -6.29 | -6.29 |
| Tax Rate, % | 26.35 | 26.35 | 26.35 | 26.35 | 26.35 | 26.35 | 26.35 | 26.35 | 26.35 | 26.35 |
| EBITAT | -32.1 | 48.4 | 61.9 | 50.5 | 96.9 | 60.2 | 66.4 | 73.3 | 81.0 | 89.4 |
| Depreciation | ||||||||||
| Changes in Account Receivables | ||||||||||
| Changes in Inventories | ||||||||||
| Changes in Accounts Payable | ||||||||||
| Capital Expenditure | ||||||||||
| UFCF | -213.6 | 31.2 | 74.4 | 43.7 | 24.7 | 43.7 | 51.9 | 57.3 | 63.2 | 69.8 |
| WACC, % | 9.52 | 9.4 | 9.42 | 9.28 | 9.42 | 9.41 | 9.41 | 9.41 | 9.41 | 9.41 |
| PV UFCF | ||||||||||
| SUM PV UFCF | 215.7 | |||||||||
| Long Term Growth Rate, % | 3.00 | |||||||||
| Free cash flow (T + 1) | 72 | |||||||||
| Terminal Value | 1,122 | |||||||||
| Present Terminal Value | 715 | |||||||||
| Enterprise Value | 931 | |||||||||
| Net Debt | -192 | |||||||||
| Equity Value | 1,123 | |||||||||
| Diluted Shares Outstanding, MM | 47 | |||||||||
| Equity Value Per Share | 24.06 |
What You Can Expect
- Flexible Forecast Inputs: Effortlessly modify key assumptions (growth %, profit margins, discount rates) to explore various scenarios.
- Comprehensive Real-World Data: Lisi S.A.'s financial information pre-loaded to enhance your analysis.
- Automatic DCF Calculations: The template computes Net Present Value (NPV) and intrinsic value for you.
- Tailored and Professional Design: A refined Excel model that customizes to fit your valuation requirements.
- Designed for Analysts and Investors: Perfect for evaluating forecasts, confirming strategies, and streamlining your workflow.
Key Features
- Genuine Lisi S.A. Financial Data: Obtain reliable pre-loaded historical performance and future estimates.
- Adjustable Forecast Parameters: Modify highlighted cells for metrics like WACC, growth rates, and profit margins.
- Real-Time Calculations: Automatic refresh of DCF, Net Present Value (NPV), and cash flow assessments.
- Interactive Dashboard: Clear and engaging charts and summaries to illustrate your valuation findings.
- Designed for All Skill Levels: An intuitive layout tailored for investors, CFOs, and consultants alike.
How It Works
- Step 1: Download the Excel file for Lisi S.A. (FIIPA).
- Step 2: Review the pre-filled financial data and forecasts for Lisi S.A. (FIIPA).
- Step 3: Adjust key inputs such as revenue growth, WACC, and tax rates (highlighted cells).
- Step 4: Observe how the DCF model updates in real-time as you modify your assumptions.
- Step 5: Evaluate the outputs and leverage the results for your investment choices.
Why Select This Calculator for Lisi S.A. (FIIPA)?
- User-Friendly Interface: Perfectly crafted for both novices and seasoned users.
- Customizable Inputs: Adjust parameters easily to suit your specific analysis needs.
- Real-Time Feedback: Observe immediate updates to Lisi S.A.'s valuation as you tweak the inputs.
- Preconfigured Data: Comes with Lisi S.A.'s latest financial information for swift evaluations.
- Recommended by Experts: Endorsed by investors and analysts for making well-informed choices.
Who Can Benefit from This Product?
- Institutional Investors: Develop comprehensive and accurate valuation models for analyzing their portfolios.
- Corporate Financial Teams: Evaluate valuation scenarios to shape and inform organizational strategies.
- Consultants and Financial Advisors: Offer clients precise valuation insights for Lisi S.A. (FIIPA).
- Students and Educators: Utilize real-time data to enhance learning and practice in financial modeling.
- Industry Enthusiasts: Gain insights into how companies like Lisi S.A. are appraised within the market.
Contents of the Template
- Operating and Balance Sheet Data: Pre-filled historical data and forecasts for Lisi S.A. (FIIPA), including key metrics like revenue, EBITDA, EBIT, and capital expenditures.
- WACC Calculation: A dedicated worksheet for calculating the Weighted Average Cost of Capital (WACC), featuring essential parameters such as Beta, risk-free rate, and share price.
- DCF Valuation (Unlevered and Levered): Customizable Discounted Cash Flow models that present intrinsic value with comprehensive calculations.
- Financial Statements: Pre-loaded annual and quarterly financial statements for Lisi S.A. (FIIPA) to facilitate in-depth analysis.
- Key Ratios: A collection of profitability, leverage, and efficiency ratios specific to Lisi S.A. (FIIPA).
- Dashboard and Charts: Visual representations of valuation outputs and assumptions designed for easy analysis of results.
Disclaimer
All information, articles, and product details provided on this website are for general informational and educational purposes only. We do not claim any ownership over, nor do we intend to infringe upon, any trademarks, copyrights, logos, brand names, or other intellectual property mentioned or depicted on this site. Such intellectual property remains the property of its respective owners, and any references here are made solely for identification or informational purposes, without implying any affiliation, endorsement, or partnership.
We make no representations or warranties, express or implied, regarding the accuracy, completeness, or suitability of any content or products presented. Nothing on this website should be construed as legal, tax, investment, financial, medical, or other professional advice. In addition, no part of this site—including articles or product references—constitutes a solicitation, recommendation, endorsement, advertisement, or offer to buy or sell any securities, franchises, or other financial instruments, particularly in jurisdictions where such activity would be unlawful.
All content is of a general nature and may not address the specific circumstances of any individual or entity. It is not a substitute for professional advice or services. Any actions you take based on the information provided here are strictly at your own risk. You accept full responsibility for any decisions or outcomes arising from your use of this website and agree to release us from any liability in connection with your use of, or reliance upon, the content or products found herein.