
|
FLOW Traders N.V. (Flow.As) DCF Avaliação |
Totalmente Editável: Adapte-Se Às Suas Necessidades No Excel Ou Planilhas
Design Profissional: Modelos Confiáveis E Padrão Da Indústria
Pré-Construídos Para Uso Rápido E Eficiente
Compatível com MAC/PC, totalmente desbloqueado
Não É Necessária Experiência; Fácil De Seguir
Flow Traders N.V. (FLOW.AS) Bundle
Aprimore suas estratégias de investimento com os comerciantes de fluxo N.V. (Flowas) DCF Calculator! Utilize dados financeiros reais, ajuste as projeções e despesas de crescimento e observe instantaneamente como essas mudanças afetam o valor intrínseco dos comerciantes de fluxo N.V. (Flowas).
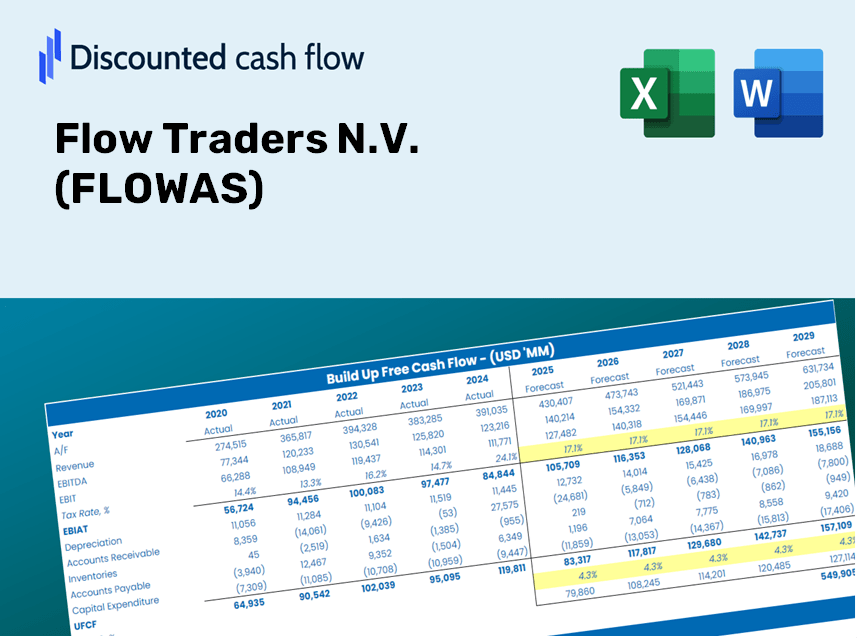
Discounted Cash Flow (DCF) - (USD MM)
| Year | AY1 2020 |
AY2 2021 |
AY3 2022 |
AY4 2023 |
AY5 2024 |
FY1 2025 |
FY2 2026 |
FY3 2027 |
FY4 2028 |
FY5 2029 |
|---|---|---|---|---|---|---|---|---|---|---|
| Revenue | 1,090.5 | 542.4 | 677.2 | 577.1 | 598.0 | 543.3 | 493.7 | 448.6 | 407.6 | 370.3 |
| Revenue Growth, % | 0 | -50.26 | 24.86 | -14.78 | 3.62 | -9.14 | -9.14 | -9.14 | -9.14 | -9.14 |
| EBITDA | 599.2 | 214.0 | 168.9 | 237.5 | .0 | 174.4 | 158.5 | 144.0 | 130.8 | 118.9 |
| EBITDA, % | 54.95 | 39.47 | 24.94 | 41.16 | 0 | 32.1 | 32.1 | 32.1 | 32.1 | 32.1 |
| Depreciation | 6.9 | 6.7 | 7.2 | 7.8 | 17.3 | 7.8 | 7.1 | 6.4 | 5.9 | 5.3 |
| Depreciation, % | 0.63726 | 1.24 | 1.06 | 1.35 | 2.89 | 1.44 | 1.44 | 1.44 | 1.44 | 1.44 |
| EBIT | 592.2 | 207.3 | 161.7 | 229.7 | -17.3 | 166.6 | 151.4 | 137.6 | 125.0 | 113.6 |
| EBIT, % | 54.31 | 38.22 | 23.88 | 39.81 | -2.89 | 30.67 | 30.67 | 30.67 | 30.67 | 30.67 |
| Total Cash | 8.3 | 4,506.0 | 8.6 | 5,502.5 | 8.4 | 221.1 | 200.9 | 182.5 | 165.8 | 150.7 |
| Total Cash, percent | .0 | .0 | .0 | .0 | .0 | .0 | .0 | .0 | .0 | .0 |
| Account Receivables | 4,633.5 | 6,160.2 | 6,022.4 | 8,107.8 | 5,969.0 | 543.3 | 493.7 | 448.6 | 407.6 | 370.3 |
| Account Receivables, % | 424.91 | 1135.84 | 889.3 | 1404.94 | 998.15 | 100 | 100 | 100 | 100 | 100 |
| Inventories | .0 | -4,501.1 | -4,876.6 | -9.3 | .0 | -219.1 | -199.1 | -180.9 | -164.3 | -149.3 |
| Inventories, % | 0 | -829.92 | -720.11 | -1.62 | 0 | -40.32 | -40.32 | -40.32 | -40.32 | -40.32 |
| Accounts Payable | 4,438.6 | 6,113.8 | 5,694.7 | 7,906.2 | 5,266.0 | 543.3 | 493.7 | 448.6 | 407.6 | 370.3 |
| Accounts Payable, % | 407.04 | 1127.28 | 840.91 | 1370 | 880.6 | 100 | 100 | 100 | 100 | 100 |
| Capital Expenditure | -6.6 | -6.8 | -7.6 | -12.1 | -6.6 | -6.7 | -6.1 | -5.5 | -5.0 | -4.6 |
| Capital Expenditure, % | -0.60791 | -1.25 | -1.12 | -2.09 | -1.1 | -1.23 | -1.23 | -1.23 | -1.23 | -1.23 |
| Tax Rate, % | 17.92 | 17.92 | 17.92 | 17.92 | 17.92 | 17.92 | 17.92 | 17.92 | 17.92 | 17.92 |
| EBITAT | 481.0 | 164.6 | 126.8 | 186.0 | -14.2 | 134.0 | 121.8 | 110.6 | 100.5 | 91.3 |
| Depreciation | ||||||||||
| Changes in Account Receivables | ||||||||||
| Changes in Inventories | ||||||||||
| Changes in Accounts Payable | ||||||||||
| Capital Expenditure | ||||||||||
| UFCF | 286.5 | 4,814.1 | 220.7 | -4,559.4 | -514.2 | 1,057.2 | 102.7 | 93.3 | 84.8 | 77.1 |
| WACC, % | 7.22 | 7.1 | 7.03 | 7.2 | 7.28 | 7.16 | 7.16 | 7.16 | 7.16 | 7.16 |
| PV UFCF | ||||||||||
| SUM PV UFCF | 1,270.6 | |||||||||
| Long Term Growth Rate, % | 2.00 | |||||||||
| Free cash flow (T + 1) | 79 | |||||||||
| Terminal Value | 1,522 | |||||||||
| Present Terminal Value | 1,077 | |||||||||
| Enterprise Value | 2,347 | |||||||||
| Net Debt | -8 | |||||||||
| Equity Value | 2,356 | |||||||||
| Diluted Shares Outstanding, MM | 45 | |||||||||
| Equity Value Per Share | 52.57 |
What You Will Receive
- Comprehensive FLOWAS Financials: Features both historical and forecasted data for precise valuation.
- Customizable Inputs: Adjust metrics such as WACC, tax rates, revenue growth, and capital expenditures.
- Real-Time Calculations: Dynamic calculations for intrinsic value and NPV.
- Scenario Analysis: Explore various scenarios to assess Flow Traders' future performance.
- User-Friendly and Professional Design: Designed for industry experts while remaining approachable for newcomers.
Key Features
- Pre-Loaded Data: Flow Traders N.V. (FLOWAS) historical financial statements and pre-filled forecasts.
- Fully Adjustable Inputs: Modify WACC, tax rates, revenue growth, and EBITDA margins.
- Instant Results: Watch Flow Traders N.V. (FLOWAS) intrinsic value update in real time.
- Clear Visual Outputs: Dashboard charts showcase valuation results and essential metrics.
- Built for Accuracy: A professional tool tailored for analysts, investors, and finance professionals.
How It Operates
- 1. Access the Template: Download and open the Excel file containing Flow Traders N.V. (FLOWAS) preloaded data.
- 2. Modify Assumptions: Adjust key parameters such as growth rates, WACC, and capital expenditures as needed.
- 3. Instant Results: The DCF model automatically computes intrinsic value and NPV for your inputs.
- 4. Explore Scenarios: Evaluate multiple forecasts to investigate various valuation possibilities.
- 5. Present with Assurance: Provide professional valuation insights to bolster your decision-making process.
Why Opt for Flow Traders’ Calculator?
- Precision: Authentic Flow Traders financial data guarantees reliable results.
- Versatility: Crafted for users to easily experiment and adjust parameters.
- Efficiency: Avoid the complexities of constructing a DCF model from the ground up.
- Expert Quality: Engineered with the accuracy and usability expected at the CFO level.
- Accessible: Intuitive interface, suitable for users with varying levels of financial modeling expertise.
Who Can Benefit from Our Services?
- Professional Traders: Enhance trading strategies with precise market analytics and insights.
- Institutional Investors: Evaluate trading opportunities and optimize portfolio performance.
- Financial Advisors: Offer clients informed investment advice based on real-time market data.
- Students and Researchers: Apply practical examples to learn and teach about trading and market dynamics.
- Market Analysts: Gain a deeper understanding of liquidity and trading strategies in markets like those involving Flow Traders N.V. (FLOWAS).
Contents of the Template
- Pre-Filled Data: Contains Flow Traders N.V.'s historical financials and projections.
- Discounted Cash Flow Model: An editable DCF valuation model featuring automatic calculations.
- Weighted Average Cost of Capital (WACC): A specific sheet for calculating WACC based on user-defined inputs.
- Key Financial Ratios: Evaluate Flow Traders N.V.'s profitability, efficiency, and financial leverage.
- Customizable Inputs: Easily adjust revenue growth, margins, and tax rates.
- Clear Dashboard: Visual representations and tables summarizing essential valuation results.
Disclaimer
All information, articles, and product details provided on this website are for general informational and educational purposes only. We do not claim any ownership over, nor do we intend to infringe upon, any trademarks, copyrights, logos, brand names, or other intellectual property mentioned or depicted on this site. Such intellectual property remains the property of its respective owners, and any references here are made solely for identification or informational purposes, without implying any affiliation, endorsement, or partnership.
We make no representations or warranties, express or implied, regarding the accuracy, completeness, or suitability of any content or products presented. Nothing on this website should be construed as legal, tax, investment, financial, medical, or other professional advice. In addition, no part of this site—including articles or product references—constitutes a solicitation, recommendation, endorsement, advertisement, or offer to buy or sell any securities, franchises, or other financial instruments, particularly in jurisdictions where such activity would be unlawful.
All content is of a general nature and may not address the specific circumstances of any individual or entity. It is not a substitute for professional advice or services. Any actions you take based on the information provided here are strictly at your own risk. You accept full responsibility for any decisions or outcomes arising from your use of this website and agree to release us from any liability in connection with your use of, or reliance upon, the content or products found herein.